Category Archive: Analysis

  1. The Dollar and Empire

    Comments Off on The Dollar and Empire

    What does the US dollar’s continued dominance in the global monetary and financial systems mean for geo-economic and geo-political power? In a recent article, Yakov Feygin and Dominik Leusder question whether the United States actually enjoys an “exorbitant privilege” from the global use of the USD as the default currency for foreign exchange reserves, trade invoicing, and cross-border lending. Like Michael Pettis, they argue that the dollar’s primacy actually imposes an exorbitant burden through its differential costs on the US population.

    Global use of the dollar largely benefits the top 1 percent of wealth holders in the United States, while imposing job losses and weak wage growth on much of the rest of the country. This situation flows from the structural requirements involved in having a given currency work as international money. As Randall Germain and I have argued in various venues, a country issuing a globally dominant currency necessarily runs a current account deficit.1 Prolonged current account deficits erode the domestic manufacturing base. And as current account deficits are funded by issuing various kinds of liabilities to the outside world, they necessarily involve a build-up of debt and other claims on US firms and households.

    A large share of those foreign claims are on US firms in the form of corporate equity. US holdings of foreign firms’ equity are roughly equal in size, but these are largely held by the top 1 percent. The bulk of US debt to the rest of the world is public and private debt, including securitized mortgages. As the top 1 percent largely avoid taxation, the broad US public is on the hook for those debts. The rich reap the rewards of dollar dominance in the form of financial rents and easier tax avoidance. Meanwhile, the rest of us compete against artificially cheap low wage imports while struggling to find affordable housing.

    Feygin and Leusder’s argument about the class basis for dollar dominance is certainly sound (which is academic-speak for: “I’ve argued the same thing so it must be correct!”). But they dismiss the geo-political aspects of dollar dominance too quickly. Two flaws in traditional histories of the nineteenth century European empires lead them to misunderstand the structure of empire and in particular the relationship between imperial centers and peripheries. Examining these missteps clarifies the global role of the British pound then, and the US dollar now.

    The first flaw sees the centers of those empires as internally coherent, unified nation states, like those that populated Europe and North America after the first and second world wars. Instead, I argue, nineteenth-century imperial European states are better understood as systems of power with permeable boundaries between the center and a hierarchically ordered, integrated set of peripheries.

    The imperial European states of the nineteenth were hardly the linguistically and culturally unified states of the postwar era. All had seen massive in-migration—including from their tropical colonies—into populations who themselves spoke distinct dialects, while also emitting millions of emigrants to the temperate zone colonies. As Ian Lustick has demonstrated, imperial officials did not draw sharp lines between center and periphery, even as they drew nearly impermeable lines everywhere on the basis of race. Consistent with Feygin and Leusder’s argument, banking elites in London, Montreal, and Melbourne had more in common with each other than with the ranchers, dockworkers, or butchers bringing Australian lamb and prairie wheat to that London banker. Metropolitan and settler elites circulated across center and periphery in parallel with the unskilled laborers in steerage, as the careers of Leo Amery or Cecil Rhodes show.

    The second and related flaw is in taking the later empires built in Africa (and to a lesser extent Asia) as the generic model, rather than the earlier British “empire of food.” From an economic standpoint—which mattered for the British pound—the real imperial action occurred earlier in the nineteenth century with the genocide and displacement of indigenous populations in thinly settled temperate zones and their replacement by mostly European settlers. Australia, Argentina, Canada, New Zealand, and, above all, the United States became prodigious exporters of the food and agricultural raw materials that fed the workers and machines of Europe’s industrial revolution. Compare: total British investment in Australia, with a population roughly 4 million in 1900, roughly equaled that in British India, with a population of over 300 million. British exports to Australia and New Zealand from 1894 to 1913 exceeded its exports to all of sub-Saharan Africa. All of that trade and investment was denominated in pounds sterling, flowing through banks with sterling-denominated ledgers, and managed, yes, by a transnational but culturally and largely ethnically British financial elite.

    This is the historical context in which we should understand the geo-political and geo-strategic advantages of the dollar’s role in the monetary system. The dollar functions not only as the currency of a specific nation, but also as the currency of a global imperial state centered on but not exclusively limited to the United States as a formal legal entity. As in the nineteenth century, the lines between the imperial core and its dependencies are blurred, those dependencies have differential status in the imperial hierarchy, challengers reside inside and outside that hierarchy, and a single currency is an important bulwark of that empire. There are four important aspects to this role for the US dollar.

    First, the dollar partially frees the US state and allies from resource constraints. In both world wars, the British temperate zone empire of food was a decisive factor tipping the balance of physical resources in favor of the Allies against Germany. And Britain’s tropical empire, particularly India, was a decisive manpower resource in World War I, providing the vast majority of combatants outside the European theatre and over 20 percent of total troop strength; the white settler colonies contributed a further 20 percent. The British empire, including its constituent parts, largely issued sterling-denominated debt to buy these physical and human resources. Similarly, dollar debt funds US special forces who train local militaries today as auxilia.

    Although there is no mechanical relationship, the cumulative US current account deficit from 1992 to 2019 equals 83 percent of cumulative US official defense spending over that period. Major expansions of the military budget run concurrent with increases in the current account deficit. In essence, current account surplus economies give the US enough consumer goods on credit to free up domestic productive resources for the outsized US military apparatus. This ability to draw on global resources rests not only on other actors’ belief that they can use those dollars in the future to purchase US goods, but also on their own economies’ reliance on the US market for growth. Excepting China after 2010, the major export surplus countries all grew more slowly than the United States after 1992, despite their export surpluses. And other major countries with current account deficits are also hostage to US growth—most obviously, Canada and Mexico. How would Britain grow if the City of London were not the global center for dollar based financial flows, or Ireland not a convenient tax haven? Holding and using dollars keeps their currencies from appreciating and pricing their exports out of world markets.

    Second, all five Anglo countries are tightly tied geopolitically to the United States through some combination of intelligence cooperation, alliance-based joint exercises, actual warfighting, and a dense network of circulating elites. The integration of military and intelligence organizations is every bit as dense as with finance, and, as with finance, there is a hierarchy of privilege and access that radiates out from the center. These military ties run parallel to the financial ones. The truism that oil exporters exchange dollar pricing of oil for US military protection can be understood in even broader terms, as the current debate over removing troops from Germany shows.

    Third, the Federal Reserve Bank is de facto the world’s central bank. By acting as lender of last resort in global crises, the Fed has structural power over almost all of the global financial system. Access to the Fed is a life or death issue for non-US banking systems in major financial crises. The US dollar is, in technical terms, global “state money” or “outside money.” Put as simply as possible, monetary systems generally are composed of both inside money (created inside the financial system) and outside money (created by the state outside the financial system). Banks exchange purchases of public debt for a license to create inside money, that is, credit to other private actors. This credit need not rely on prior savings. Rather, the extension of credit creates a loan, which shows up as an asset; the simultaneous deposit of loan funds into the borrower’s account creates a liability for the bank. Et voilà, new money now exists. Globally, non-US banks generate almost all of the 60 percent of cross-border lending that is US dollar-denominated. In other words, they voluntarily create the dollar liabilities on their balance sheets that make them ultimately depend on the Fed in a crisis. But ‘voluntarily’ here needs to be understood in the context of societies whose exports to the United States transform stagnation into merely mediocre growth. The Eurozone’s cumulative export surplus from 2011 to 2018 equals 90 percent of the US cumulative current account deficit.

    Only regulation and bankers’ weak self-discipline limit the creation of inside money. In the 2000s, European and other banks took dollars earned through their trade surpluses and dollar-denominated inside money created in the eurodollar system and recycled them into global lending. The balance sheet of the average European or Canadian banking system was over one-third dollar denominated, amounting to roughly $14 trillion of assets in 2017. This created considerable vulnerability if, as in 2008 and 2020, the collateral backing the asset side of the balance sheet collapsed and borrowers defaulted on their loans. All those banks needed US dollars, but their central banks could not create outside money to bail out banks’ US dollar-denominated liabilities. Instead, the Fed created dollars—outside money—to lend to those central banks for on-lending to their local systems. As with military cooperation, more tightly integrated and cooperative countries received better treatment and faster access to these swap lines. The inner Anglo-circle of financial ties is so close that some analysts refer to “Anglo-American finance” as a coherent whole, and describe the Bank of Canada as the “13th Federal Reserve Bank.” The use and recycling of dollars maintains the transfer of resources noted in the first two points above.

    Fourth, widespread use of the dollar means that most trade and financial flows are settled through plumbing controlled by either the US state or entities regulated by the US state. This gives the US state, mostly via the Treasury Department, a kind of tactical or operational power vis-à-vis non-US financial systems in non-crisis situations. The global financial plumbing system uses the Fed-wire, CHIPS and SWIFT networks, which largely settle through New York. Regulatory oversight of the networks and non-US banks’ need for a presence in the United States give the US state the ability to compel behavior from non-US banks. For example, the threat of exclusion from clearing networks compels foreign banks to comply with sanctions against geo-political enemies. SWIFT expelled Iranian and North Korean banks from its payments network, greatly hindering their nuclear programs and their normal commerce. The US state also used the threat of expulsion from the payments network to compel banks to enforce sanctions on some Russian banks and firms after Russia invaded Crimea. The US state similarly used SWIFT data on global financial transfers to identify and target terrorist groups. The Fed supplies the carrot of crisis management, while the Treasury wields the stick of exclusion from the payments system.

    Analysis like Feygin and Leusder’s is correct call out the exorbitant burden the US dollar imposes on the non-elite US population. But that burden needs to be seen in the context of the overall system of power radiating unevenly from Washington, New York, Silicon Valley, and so on, through a network of allied states, firms, and free floating intellectuals that cross the permeable boundaries of formal citizenship and legal domicile. That system of power is anchored in and funded by use of the dollar as the de facto currency of a global imperial state centered on (not in) Washington. The exorbitant privilege does not net out the exorbitant burden; it is the obverse of a coin held by much of the global power elite.


    1. The current account deficit (or surplus) adds the balance on investment income, labor income, and unilateral transfers (like foreign aid or remittances) to the trade deficit (or surplus) on just goods and services. ↩
  2. The Crisis and the Free Market

    Comments Off on The Crisis and the Free Market

    Will the current crisis transform America’s politics and economic institutions? With unemployment higher than at any point since the Great Depression, rising food insecurity, and an increasingly muscular role for government—are we witnessing the beginning of the end of the four-decade-long era of the free market ushered in by Ronald Reagan? It’s a question worth considering, whether you’re a Democrat who blames the rising inequality of the last four decades on the policies of smaller government, or a Republican who thinks those policies saved America.

    It wouldn’t be the first time a crisis has altered the trajectory of the country. The Republican Party of today is defined by its commitment to tax cuts, deregulation, and cuts in social spending. But prior to the Reagan administration, the Republicans were actually the party seen as most likely to increase taxes, because their main commitment throughout the post-war period had been to avoid deficits. The party was, in Newt Gingrich’s famous dismissal, the tax collector for the welfare state.

    It was the economic crisis of the 1970s that led Republican politicians to offer proposals that radically rethought the economic order, and it was the economic crisis that led citizens to vote for some of those proposals. One of the most consequential was the party’s coalescing around the issue of tax cuts. A faction led by Congressman Jack Kemp began to argue that tax cuts could be popular, and could offer a Republican alternative to what they saw as the Democrats’ strategy of offering welfare programs for electoral purposes. In Kemp’s words: “Let the Democrats be the party of deficit spending. We are the party of lower taxes. Let the Democrats be the party of quick-fixes and more government jobs. We are the party of private enterprise jobs. Let the Democrats be the party of inflation. We are the party of a sound dollar.”

    When progressives ask why Republicans are so fixated on free market policies, they almost invariably conclude that Republicans must be in the pockets of business. But although businesses do influence policy (the tax cut of 2017 being the most prominent example in this administration), that’s not the whole story, or even the major part of the story. As I document in my book Starving the Beast, a history of the Republicans’ reorientation to the politics of tax cuts, many business groups actually opposed Reagan’s tax cut politics because they worried about deficits. In 1981, during Reagan’s campaign for the big tax cut that was the cornerstone of his domestic economic policy—the tax cut that inaugurated the era of tax cuts—business leaders tried to talk him out of it, arguing that the policy had a “consumption bias.” Reagan and his team held that the tax cut would increase the savings rate and the incentive to work, thereby raising productivity and investment. But business leaders were not convinced, and did not come on board until Reagan added a specific proposal that would help businesses (one that he removed the very next year).

    The White House had to convince reluctant business leaders again for George W. Bush’s tax cuts in the early 2000s. In fact it’s only in 2017 that businesses climbed aboard the tax cut bandwagon, partly because it was clear at that point that tax cuts were the only policy the Republicans could actually achieve. In many cases where businesses have been more significant agents, such as the repeal of Glass-Steagall, or the bankruptcy reform of 2005, or right to work laws, the victories only brought American policies in line with what is the standard practice in many European countries, even the most social democratic ones. Business power is overestimated.

    Another explanation commonly advanced for the Republicans’ embrace of free market policy revolves around ideology: some argue that Republicans hold on to free market policies because they genuinely believe them. But this is also an insufficient response. Why do Republicans genuinely believe in tax cuts as a recipe for economic growth, when the evidence for this is at best weak, and at worst nonexistent? This commitment is all the more puzzling given the dramatic ideological shifts the party has undergone in the past. During the Reagan administration, Republicans were prepared to completely jettison their deeply held belief in balanced budgets, for example, with public debt increasing from 33.4 percent of GDP at the start of Reagan’s term to 51.9 percent at the end.

    A better explanation for why Republicans are so committed to free market policies is hidden in the Gallup Poll. For several decades, Gallup has been asking Americans this question: “Looking ahead for the next few years, which political party do you think will do a better job of keeping the country prosperous—the Republican Party or the Democratic Party?” Examining responses to this question over decades reveals an interesting pattern: since 1980, the version of this question asked in fall of the election year has correctly predicted the president in almost all cases, and the only exception, the election of 2000, adds rather than takes away from its utility as a barometer. Because of the stagflation of the 1970s, and then because of the wage stagnation and economic instability of the following decades, Americans have been increasingly likely to respond that the state of the economy matters to them and influences their vote choice. These changing priorities coincided with an astonishing change in party perceptions: in the 1960s, Democrats were considered more likely to handle the economy well than were Republicans, with an advantage of nearly 40 percentage points, but they lost that advantage in 1980, and have traded places with the Republicans for it ever since.

    In other words, Republicans gained tremendously in the perception among the public that they are able to handle the economy well, at precisely the moment when Americans started to say they cared about the economy. One reason for this was the Republicans’ policy of tax cuts and of free market policies in general, which gave the party a story of how they would bring about economic growth. In the time of Kemp and Reagan, inflation was pushing Americans into higher tax brackets, and the Republicans were right that tax cuts would be popular. Ever since, these policies have allowed Republicans to construct a coherent narrative around the premise that they are the party that cares about business, and to paint the Democrats as the party that only wants to spend money.

    The recent problem for the party is that the tax cut strategy has diminishing returns, because Republicans have been so effective at cutting people’s taxes that Americans are no longer as upset about paying them. This is one reason for the party’s sudden lurch to xenophobia, as there are not many other issues a party that rejects welfare policies can use to attract a large coalition of voters.

    One strategy for predicting whether the Republican Party of tomorrow will look like the Republican Party of yesterday is to watch that Gallup number like a dial when it comes out later this year. We may be moving into a different era, when cultural factors and appeals to racism mean the perception of which party better handles the economy is no longer as influential on the vote. If so, free market policies will no longer be so prominent on the Republican agenda. But there is another possibility: if voters still care about which party better handles the economy, and if the current president’s handling of the economy reflects on his party, one of the pillars for the Republican Party’s post-Watergate renaissance will start to crumble. In either case, as the crisis of stagflation began the era of Reagan, the coronavirus crisis could end it.

  3. Pandemic and Poverty

    Comments Off on Pandemic and Poverty

    Since the onset of the Covid-19 pandemic in the United States, more than 40 million people have applied for unemployment benefits. In April, unemployment spiked to nearly 20 percent, almost double the rate observed at the peak of the Great Recession. To blunt the financial blow, Congress passed the CARES Act, a package that included, among many other things, around $500 billion in income transfers for the U.S. population.

    With my colleagues at Columbia University’s Center on Poverty & Social Policy, I have worked to understand how the CARES Act might affect annual poverty rates in the U.S. Our findings took us by surprise: despite the rapid rise in unemployment, we find that the CARES Act’s two major income transfers—the Recovery Rebates (one-time stimulus payment) and expanded unemployment benefits—have potential to return projected poverty rates to pre-crisis levels if access to the benefits is adequate. Jason DeParle of The New York Times neatly brings life to the findings here, while our full report can be found at the Center’s website. The report also details the many important shortcomings of the CARES Act, such as its exclusion of undocumented immigrants, the difficulties that families are facing in accessing the benefits, and the upcoming expiration of the top-up to unemployment benefits.

    While our findings suggest that the CARES Act is effective at reducing poverty, they also raise fundamental questions about how we define and measure poverty. Consider that other recent studies have convincingly found rising levels of food insecurity, uncertainty, and hardship. If poverty rates remain relatively stable, we have to ask: is our definition of poverty consistent with the experience of families living below the poverty line? Are the conventional tools we use to assess the incidence of poverty fit for the present moment? These questions are not merely academic: comparisons of poverty rates across place and time are used to assess the efficacy of policy responses and the economic wellbeing of a nation’s population, as well as to guide future policy decisions. Given the stakes, it should concern us if the experience of poverty does not align with our measurement of poverty. Assessments of the CARES Act on poverty rates reveal one way in which our current approach to measurement might fall short.

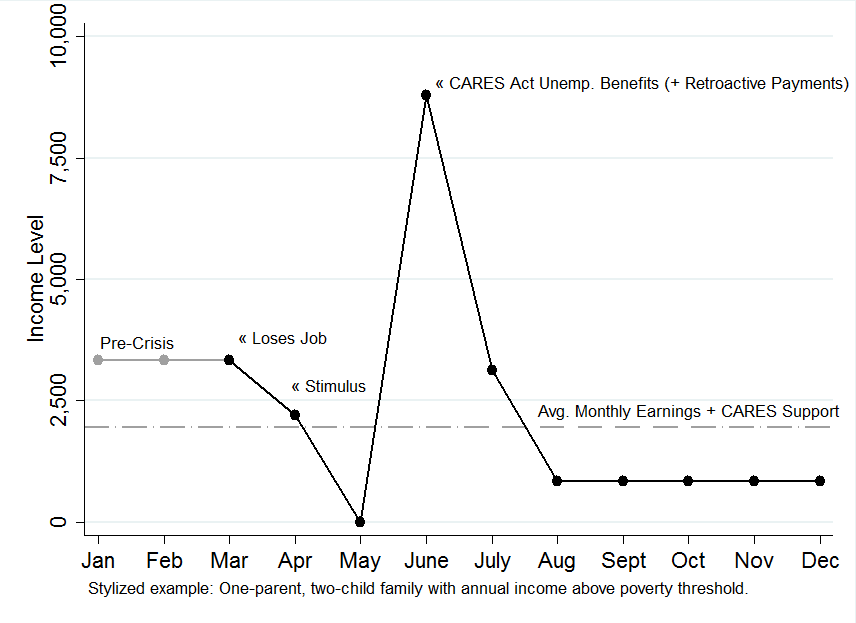
    To illustrate these concerns, I describe the income situation of a hypothetical family over a 12-month period, discuss whether our definition of poverty aligns with that family’s experience, and consider the policy implications of this distinction.

    Figure 1: Stylized example of income volatility throughout year for single parent receiving CARES Act Recovery Rebate (“stimulus”) and unemployment benefits1

    The figure above presents the stylized income situation of a single mother with two children. In this example, the mother loses her job in March, but cannot access her unemployment benefits until June. (This is the reality for many jobless adults applying for unemployment benefits, particularly in states like Florida, which have responded slowly to the crisis.) In April, the mother receives her stimulus check, but nothing more. In May, she receives nothing as she awaits her unemployment benefits. And finally, in June, she receives her unemployment benefits, as well as the retroactive unemployment payments she is due for the prior two months.

    The real trouble begins in August, the month after the $600 per week unemployment bonus (Pandemic Unemployment Compensation, or PUC) is set to expire.2 From August through December, the single mother is left with a few hundred dollars per month in extended unemployment benefits. As a result, this family lives six months of the year with very little income.

    Does this family live in poverty? If you asked the single mother in December, after half a year of minimal income support, she would likely say yes. But according to the Supplemental Poverty Measure (SPM), and most other annual poverty frameworks, the answer is no. The family’s annual income just surpasses the poverty threshold. Though nearly one-third of the family’s annual income comes in a single month, and though the family must scrape by for half a year without decent, regular income support, the CARES Act does just enough to lift the family above the line.

    This is where our conventional approach to poverty measurement misleads us.

    In past research on intra-year income volatility, scholars have demonstrated that it’s not just about how much a family makes over the course of the year, but whether that family can count on a consistent income from month to month. In The Financial Diaries, for example, Jonathan Morduch and Rachel Schneider vividly capture the challenges experienced by families who have annual incomes above the poverty line, but face large month-to-month swings in income. In the low months, such families resort to borrowing from friends and family, negotiating with creditors, or foregoing basic necessities to get by until their incomes improve. Put differently, these families experience poverty throughout the year, even if their annual incomes exclude them from official estimates. The single mother we described above is likely no different. After several consecutive months with little to no income support, she likely experiences poverty, even if our data suggest that the CARES Act puts her over the poverty threshold for the year.

    The income volatility dilemma has clear implications for how we structure benefit provisions. For real families, the timing of income support is critical. For the mother who lost her job after the onset of the crisis, it matters whether the income support arrives in March rather than June; for the researchers evaluating her annual poverty status, it makes no difference. The CARES Act magnifies this distinction due to both the size and timing of the payments. The amount of income transfers distributed between March and July 2020 is without precedent, but state administrative challenges have delayed the receipt of income support for millions. That said, concerns of policy-induced income volatility are not unique to the CARES Act or the present crisis. The Earned Income Tax Credit (EITC) and Child Tax Credit (CTC) also provide benefits on a single-payment basis, lumping thousands of dollars in income support into a once-per-year payment around tax time. Even if these refundable tax credits were measured perfectly in our income data (they are not), evidence suggests that annually-distributed allotments of funds lead to different consumption outcomes compared to monthly cash support. Studies evaluating how families spend their EITC, for example, find that much of it goes toward debt and bills.

    The standard defense for the EITC and other one-time or concentrated transfers is a simple one: consumption smoothing. The single mother described above, some argue, should save some of that $9,000 she receives in July to smooth her consumption over subsequent months. But there are two major problems with an uncritical resort to the consumption smoothing argument. First and most obviously, many low-income families cannot smooth consumption backwards. Put differently, what does our example family do in May, a month without income, while awaiting unemployment benefits that arrive in June? Debt-financed consumption is an option for some, but that debt doesn’t show up in our income data, further complicating our assessments of poverty.3

    Second, consumption smoothing is increasingly challenging when the number of months over which you must smooth is unknown. Consider that the Congressional Budget Office projects an unemployment rate of around 10 percent to persist through the end of 2021. Our single parent would have an easier time smoothing consumption if she knew she could go back to work in August. However, many of the recent unemployed do not have the luxury of knowing when their next paycheck will arrive.

    There is an obvious solution to this trend of policy-induced income volatility: deliver cash assistance to families on a regular basis throughout the crisis (and beyond). In the absence of quick policy change, however, we’re left with a patchwork welfare state and a mix of indicators for understanding how families are coping.

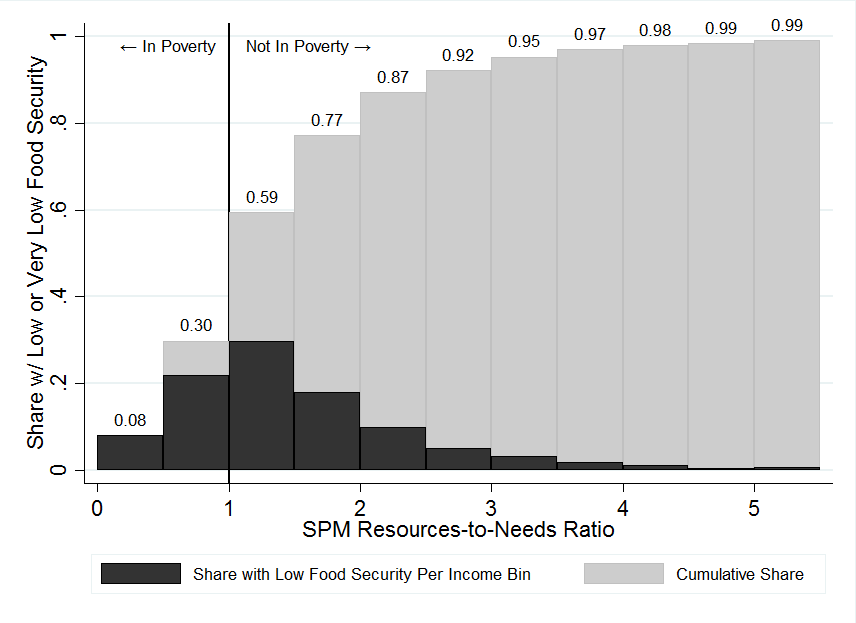
    In addition to annual income, scholars have projected trends in food insecurity, an acute version of material hardship. The recent data suggest that levels of food insecurity are high and rising. These indicators are informative, and may be a more useful indicator than changes in annual poverty rates during times of economic crisis. Empirically and conceptually, however, food insecurity and poverty have long been detached. The empirical evidence is presented in Figure 2, which shows the relationship between poverty status (again using the Supplemental Poverty Measure) and food insecurity averaged over 2009 to 2017.

    Figure 2: Share of households experiencing low or very low food security by poverty status and income bin, average over 2009-20174

    The gray bars show the cumulative share of households experiencing low or very low food security (Y-axis) over the distribution of households’ resources-to-needs ratio (X-axis), with a resources-to-needs ratio below 1 indicating that the household lives in poverty. The black bars show the share of households with low or very low food security per each income bin. The conclusion is clear: only 30 percent of households experiencing food insecurity actually live with annual incomes below the poverty line. The largest incidence of food insecurity is found just above the poverty line among those with incomes between 100 to 150 percent of the poverty threshold. One-quarter of households experiencing food insecurity are above 150 percent of the poverty line.

    From a conceptual perspective, the giants of poverty research might suggest that a mismatch between poverty and food insecurity is not, in itself, cause for concern. From Townsend to Atkinson to Citro, poverty scholars have long recognized that poverty is not simply a synonym for acute deprivation, but instead reflects a lack of resources necessary to “obtain the type of diet, participate in the activities, and have the living conditions and the amenities which are customary” in society. Given the volatility that the CARES Act has introduced, we’re forced to ask ourselves: is a focus on annual income still sufficient to assess whether a family meets that standard?

    In 2020, following the passage of the CARES Act, the American welfare state’s collection of direct income transfers is largely composed of a one-time stimulus payment, an allocation of unemployment benefits concentrated over a four-month period, and several once-per-year tax credits that have been expanded in recent decades. The CARES Act transfers could offset increases in annual poverty rates, yet leave many families with little to no income support throughout the second half of 2020. This fact alone should challenge whether our accounting of families’ poverty status is fit for the moment.

    Moving forward, poverty scholars should grapple with the following question: does an annual accounting of resources misrepresent how families actually experience poverty? If so, we should update our measurement practices accordingly.


    1. Stylized example represents single-parent, two-child family in state with average living costs. Parent is assumed to lose employment in March, but is unable to access unemployment benefits until June. This scenario assumes the parent receives the $600/week Pandemic Unemployment Compensation bonus through its expiry in July, but continues to receive minimum unemployment benefits through December. Figure from Parolin, Curran, and Wimer (2020). ↩
    2. This family type may also receive SNAP benefits, cash assistance from TANF, or other small sources of income support. These are excluded from the stylized example for simplicity. ↩
    3. For more on debt and poverty measurements, see: Short (2005) and Scott and Pressman (2013). ↩
    4. Note: Estimates from December CPS supplement merged with corresponding households in CPS ASEC over 2009 to 2017. N=204,922. SPM resources-to-needs ratio represents a unit’s combined annual resources (including all taxes and transfers) relative to its poverty threshold, so that values below 1 indicate that the family unit lives in poverty. Food security status is measured according to the number of affirmative answers to a broad range of food security questions developed by the Food and Nutrition Service of the U.S. Department of Agriculture. ↩
  4. Declining Access, Rising Cost: The Geography of Higher Education Post-2008

    Comments Off on Declining Access, Rising Cost: The Geography of Higher Education Post-2008

    Explore our maps here.

    During and after the Great Recession, public funding for higher education was slashed as state budgets imposed austerity measures. Staff and programs were cut and tuition rose; in many states, even by 2018, funding had not returned to pre-recession levels. Meanwhile, enrollment soared. As students locked out of a slack labor market were told they lacked the skills necessary for today’s jobs, the solution to unemployment and wage stagnation was to be found in the pursuit of more degrees at higher prices. The result was the acceleration of what is now a four or five-decade trend in US higher education: the replacement of a public good model with a private consumer model, dependent on tuition financed with federal debt, all justified on the back of supposed earnings increases that fail to materialize.

    With skyrocketing prices and ballooning student debt, the private for-profit model has taken hold in even traditional schools, which are seeking to cut teaching costs while retaining students and their hefty tuition payments. Even leaving aside the possible collapse of tuition revenues from nonattendance, forecasts for state budget cuts coming out of the Covid-19 recession are alarming—unless the patterns of the Great Recession are avoided, we can abandon hope of a more equitable, inclusive, or expansive higher education landscape into the 2020s.

    Our goal in this study is to help policymakers understand the changing landscape of US higher education since 2008, and to direct attention to geographical areas likely to be the most adversely impacted by continued austerity in higher education. We will do this in two ways. First, we calculate a zip-level measure of concentration—that is, how many higher education institutions are in each zip code, and how evenly enrollment is distributed among them—to ask if the higher education market in certain areas is effectively monopolized (one institution enrolling most, if not all, students nearby) or if there a handful of institutions with similar student body sizes (indicating choice among the institutions). Second, we examine how this concentration has changed since the Great Recession and whether there have been effects on the cost of attendance. For example, do monopolized areas experience higher prices? Accompanying this study is an interactive map, where researchers can explore changes in school concentration and price over time, observe key statistics, and download all of our data.

    A map showing higher ed concentration in the United States.

    The research we present here builds on a previous report that introduced our school concentration index (SCI). The SCI is a measurement that assesses the concentration of higher education institutions in a given geographical region. SCI varies from 0 (perfectly unconcentrated/competitive) to 10,000 (complete monopoly) to null (education desert). We’ve computed the SCI for every zip in the US and US territories for 2008–2017, including satellite campuses offering degree programs. (The analysis we discuss in this post was completed using 45 minute driving distances around higher ed institutions; to investigate 30 or 60 minute driving distances, explore the interactive map.)

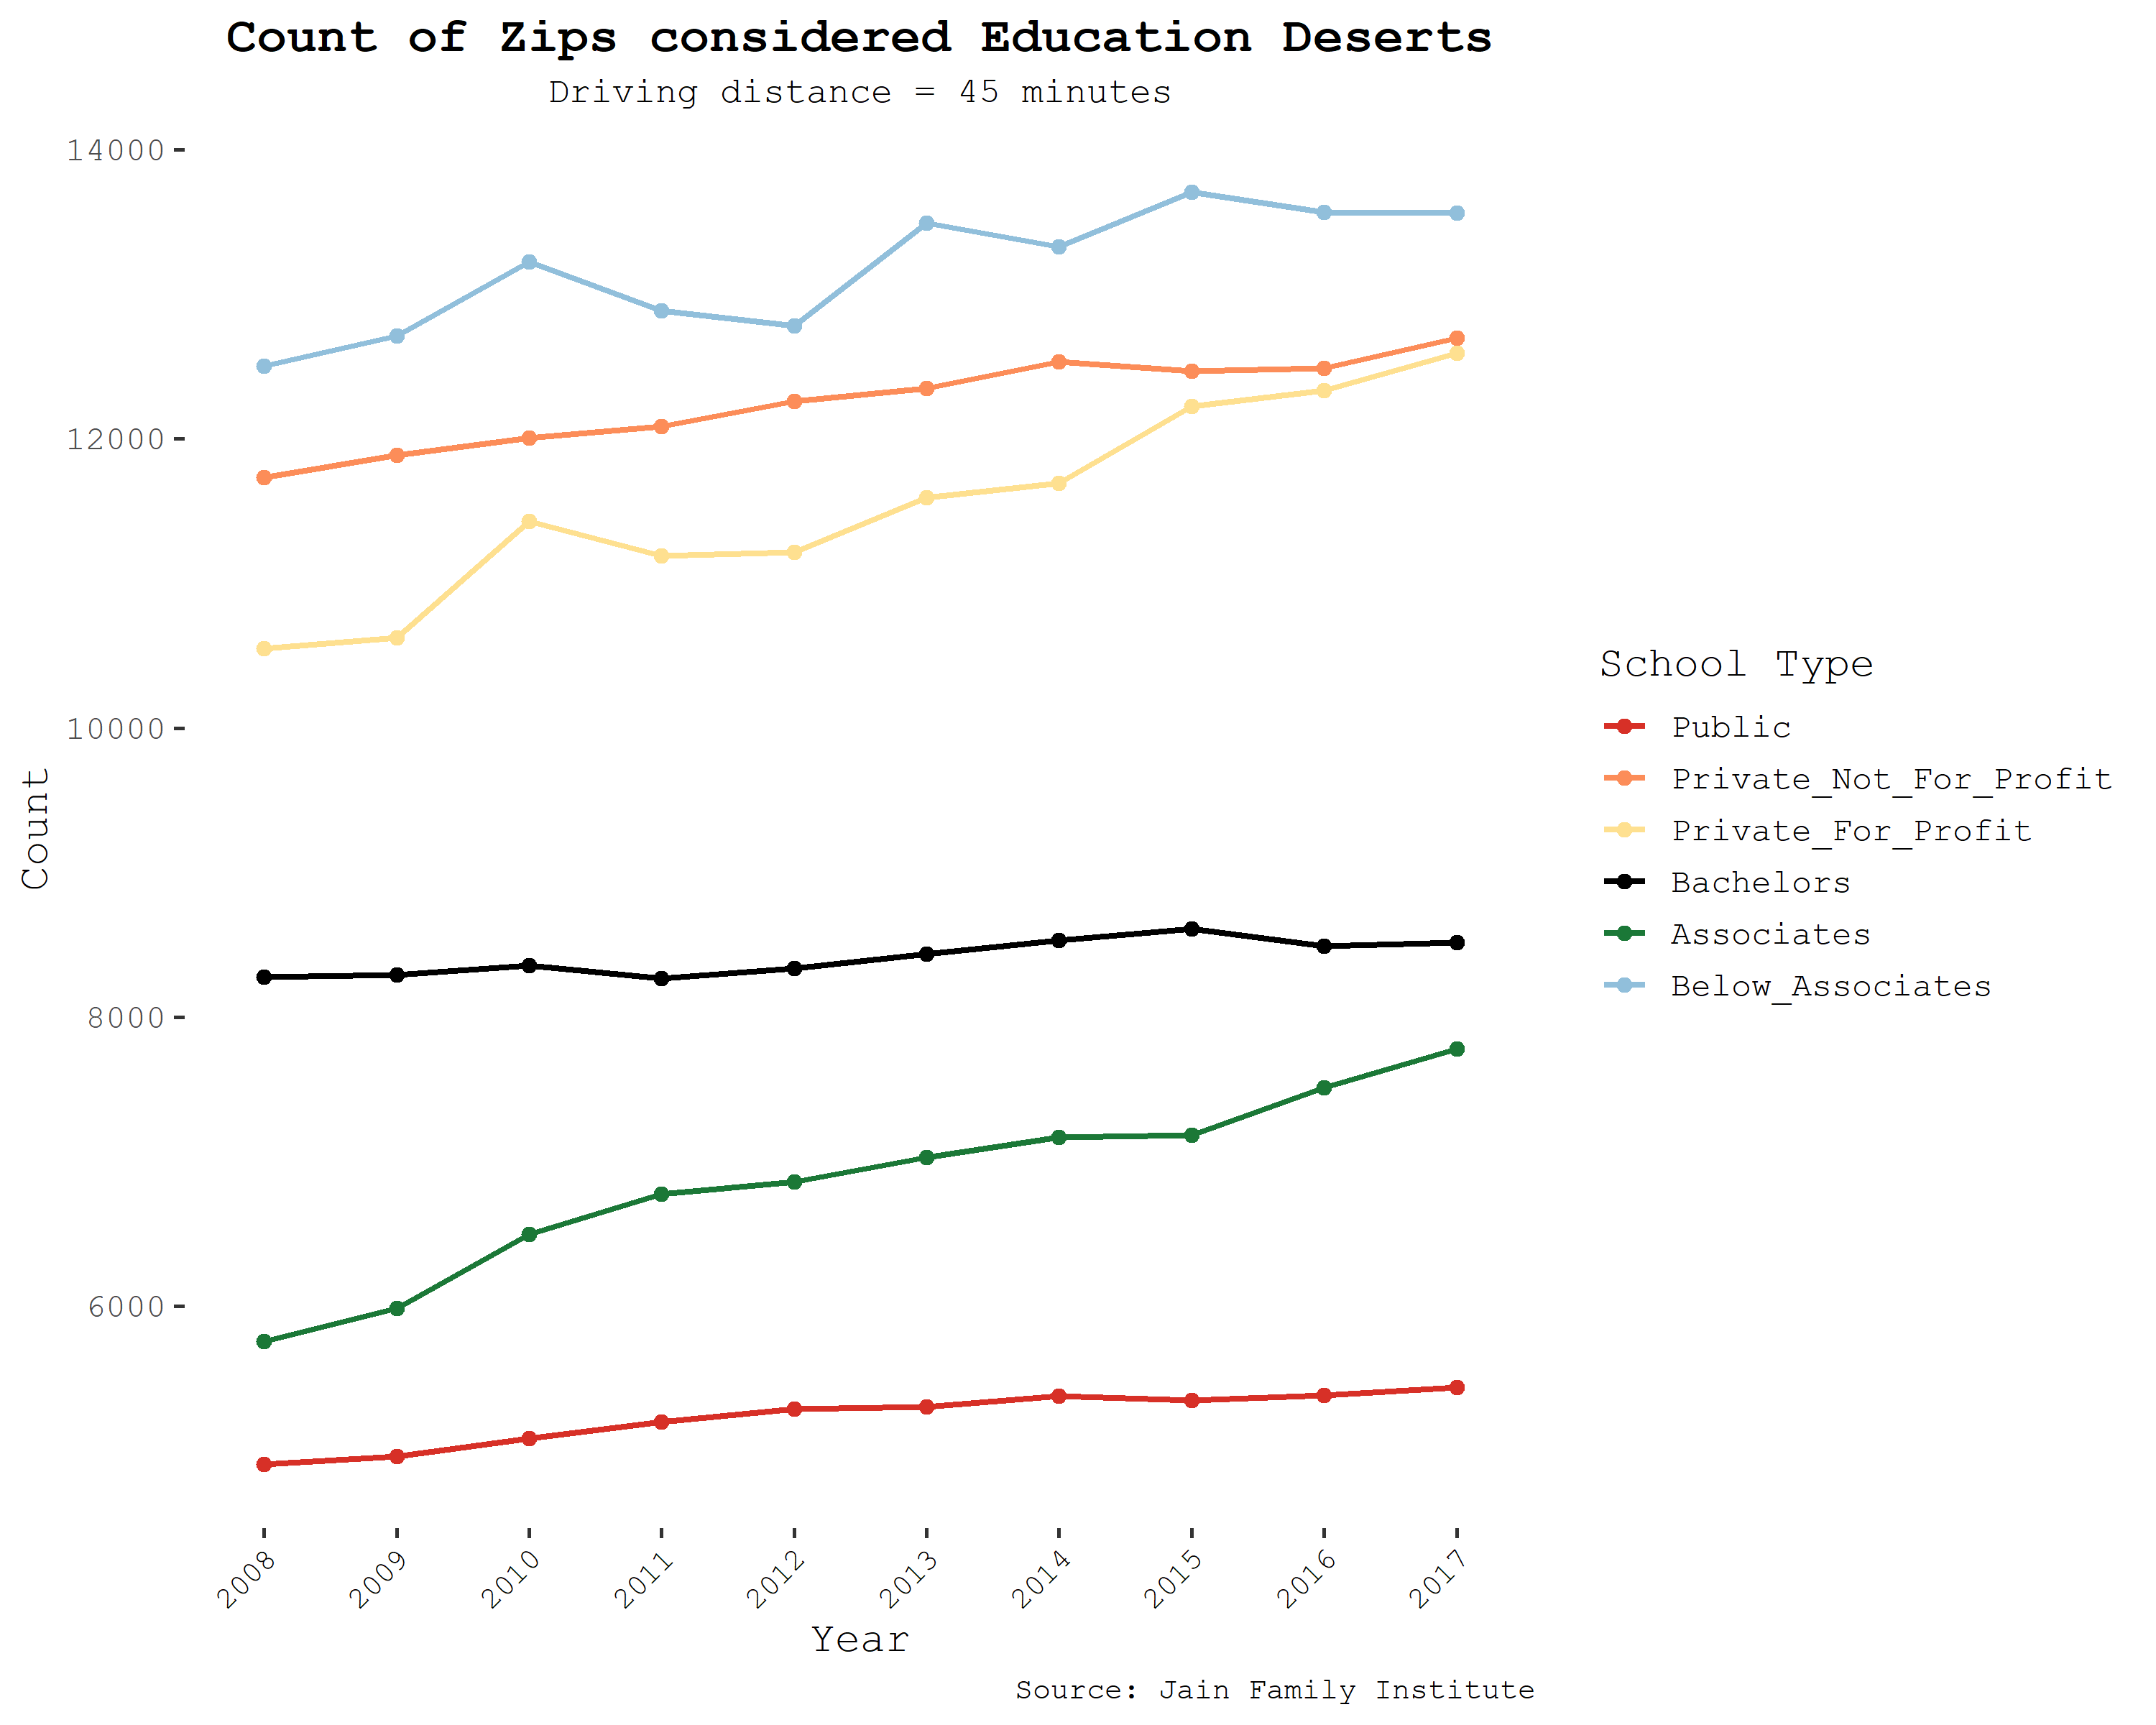
    As much research has previously indicated, institutional choice has decreased in the wake of the Great Recession. For all higher ed institutions, regardless of school type, the aggregate count of campuses has diminished, institutional competition has deteriorated (indicated by the concentration increasing), and zip codes considered education deserts have proliferated. These trends are mostly consistent when looking at specific school types as well—while 2-year institutions have been affected more than others, all types of higher ed have suffered these changes. In the below figures we break these stats down, observing all school types together, and school categories and degree types separately.

      All Schools 
     Campus Count National Median SCIEd Desert Zip Count
    2008706229073642
    2017674033574087
    % Change-4.56%15.48%12.22%

    Time Trends

    The number of campuses has diminished between 2008 and 2017, and enrollment has been increasingly concentrated in larger institutions. These general trends have been driven by a number of well-documented factors:

    • The for-profit sector boomed during the high unemployment years of the Great Recession, but it has since gradually lost market share as the typically marginal and non-traditional populations it served (such as older students, parents, and first-generation college students) were more likely to be at work as the labor market recovered, and since its high prices and poor service have generally eroded its reputation with the public. Several large chains have gone bankrupt, generally interpreted as good news for the students they misled and in theory entitling students who took out loans to attend them to have those debts discharged—to little avail, thus far. But that does have the effect of increasing the concentration of enrollment, since the remaining institutions will account for a larger share of all enrollment.
    • State funding for higher education declined in the recession and never fully bounced back relative to the demand from students. These funding cuts and the sluggish recovery have prevented new campuses from opening to meet that demand (as they once did), and channeled students into larger classes on existing campuses.
    • Traditional institutions began operating on the tuition-driven business model of the for-profits, channeling demand into alternative paths for degree completion and increased online offerings. The corresponding enrollment growth—without expanding campuses or hiring more full-time stably employed faculty—in for-profit-like programs at traditional institutions increased concentration in those institutions.

    Our study concludes in 2017, but the trends are clear. Millions are subjected to effectively monopolized higher education markets with diminishing quality. If we split the US population into bins based on the concentration they face (from high competition to monopoly to desert), we see that between 2011 and 2017, more and more people are living in highly concentrated markets. For example, between 2011 and 2017, roughly 2 million people went from having at least two higher ed options down to one or zero in 2017. This trend occurred in every school type, with the worst increases happening in the Associate’s level category, which has seen a 27% increase, from 39 to 49.8 million affected people. Given the ever-increasing costs of higher education, policymakers need to be especially aware of these areas.

       People Within SCI Bins   
    School Type SCI SCI≤2,500 (More than four options for students)2,500< SCI≤5,000 (Between two and four options)5,000< SCI<10,000 (Between one and two options)SCI=10,000 (One option)Education Desert (No Higher Ed Institutions Nearby)
    All Schools2011223.5M48.0M25.3M8.6M4.6M
     2017222.5M57.7M29.0M9.9M5.1M
     % Change-0.5%20.2%14.6%14.9%10.3%
    Public2011175.8M68.9M34.3M22.8M8.2M
     2017174.3M81.3M35.3M24.6M8.6M
     % Change-0.8%18.1%2.8%7.7%5.0%
    Private (not-for-profit)2011125.6M71.7M41.1M28.5M43.2M
     2017122.5M77.1M42.8M34.8M47.0M
     % Change-2.5%7.5%4.2%22.1%8.8%
    Private (for-profit)2011172.9M58.7M27.2M22.5M28.9M
     2017143.9.5M74.0M45.2M25.7M35.4M
     % Change-16.7%26.0%66.3%14.1%22.7%
    Bachelors2011144.0M74.6M46.7M25.3M19.4M
     2017128.7M93.9M53.5M27.8M20.3M
     % Change-10.7%25.9%14.5%9.9%4.3%
    Associates2011170.2M65.9M35.0M24.8M14.1M
     2017172.5M66.6M35.4M30.5M19.2M
     % Change1.3%1.0%1.0%22.8%36.1%
    Below Associates2011165.4M50.2M28.2M25.7M40.5M
     2017149.3M64.1M32.6M34.8M43.3M
     % Change-9.7%27.6%15.7%35.3%7.0%

    While millions experience highly concentrated higher education landscapes, millions more live in education deserts. These areas, which have absolutely no higher education institution nearby (concentration is null), are particularly worrisome given that over half of all higher education students in the US attend close to their home. Population increases in deserts for public and 4-year college are modest, whereas increases in deserts of for-profits, 2-year institutions, and below 2-year institutions are more disquieting. These are the schools that nontraditional students tend to go to. While it’s arguably a good sign that for-profits and certificate programs have lost some market share since the recession, the fact that this has been accompanied by the adoption of their predatory business models by traditional higher ed means students are probably not significantly better-off.


    One response to the evidence about diminishing access for rural and nontraditional students is that online learning offers a flexible alternative to in-person classes. But the recent simultaneous mass experience with online learning as a result of the COVID pandemic shows that—at least thus far—it’s an alternative with significant downsides for learning. To make the picture starker, there is a strong negative relationship between broadband internet access and higher ed concentration. The below table uses 2017 FCC data at the zip code level, showing that both telecom-reported average maximum download speeds and the number of available providers are much lower where education is more highly concentrated.1 Thus, higher education concentration cannot be rationalized with reference to online learning, when that’s made impossible by such unequal broadband service.

    This pattern highlights the nexus between concentration in one sphere of the economy and concentration in another. Just as telecoms oligopolists fail to provide reasonable service outside their most profitable areas, private higher education institutions are unlikely to provide access to high quality education to the communities who need it most. In either case, competition need not be the sole remedy—a high-quality, low-cost public provider has been proposed as a way to guarantee universal service for broadband, and may do the same for higher education.

       Average Maximum Advertised Downstream Speed (Mbps)  
     SCI SCI≤2,500 (More than four options for students)2,500< SCI≤5,000 (Between two and four options)5,000< SCI<10,000 (Between one and two options)SCI=10,000 (One option)Education Desert (No Higher Ed Institutions Nearby)
    All Schools198.12134.65129.00113.31105.65

    When we divvy up zip codes into regional categories, we can observe further discouraging patterns. Everywhere, regional concentration has trended upwards. The Rocky Mountains, Plains, and Southwest regions have the highest region-wide median concentrations and have also seen the steepest increases since 2008. In 2008, the Rocky Mountain and Plains regions had median SCIs of 4,466 and 4,179 respectively; by 2017, those statistics had jumped to 7,532 and 5,893. There are no blanket explanations for the increase in regional concentrations. In some regions, like the Rocky Mountains, campus counts and enrollment increased over the time period, indicating that even though there has been a response to increasing demand, that response has been insufficient (and in many cases comes from the for-profit sector). In others, like in the Southwest and New England, campus counts decreased while enrollment increased, indicating that students are clustering in established higher ed programs. Remaining regions have seen decreases in both campus count and total enrollment; most likely a symptom of the shrinking college-aged population. Experts have predicted certain areas will fare worse than others moving into the 2020s, and trends herein support these claims. The cartograms below show the change in SCI in the US over the years of analysis. States are sized according to aggregate enrollment for that year.

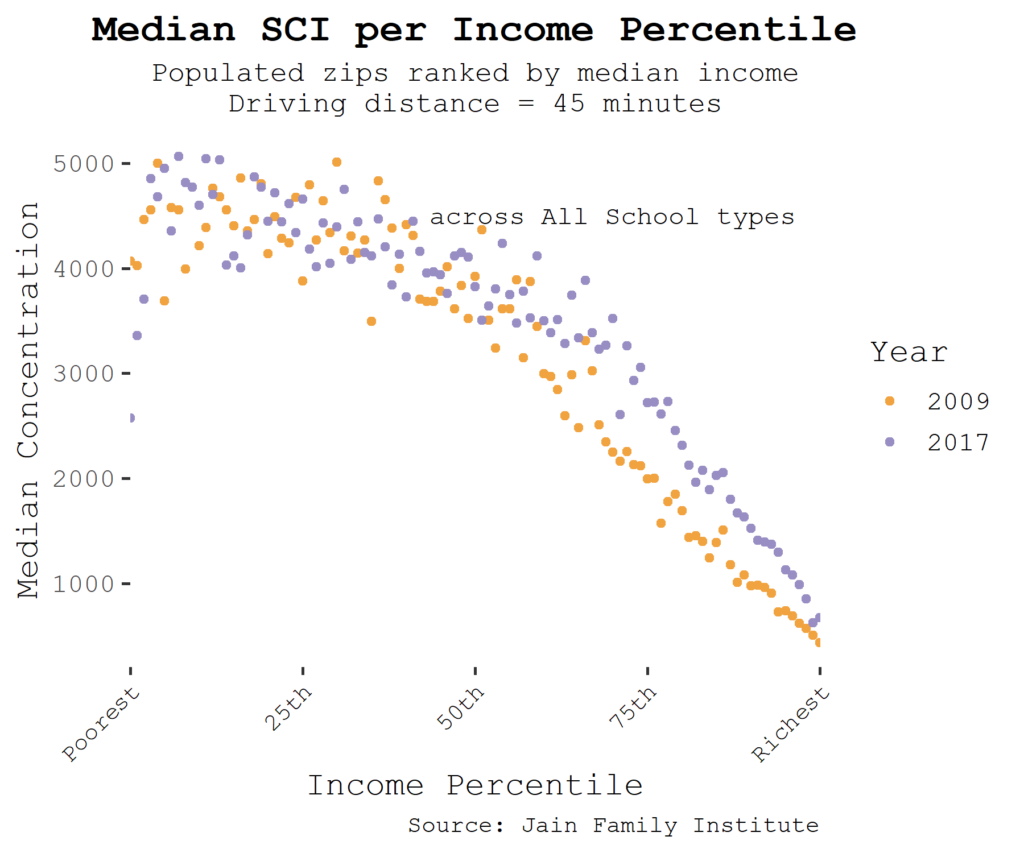
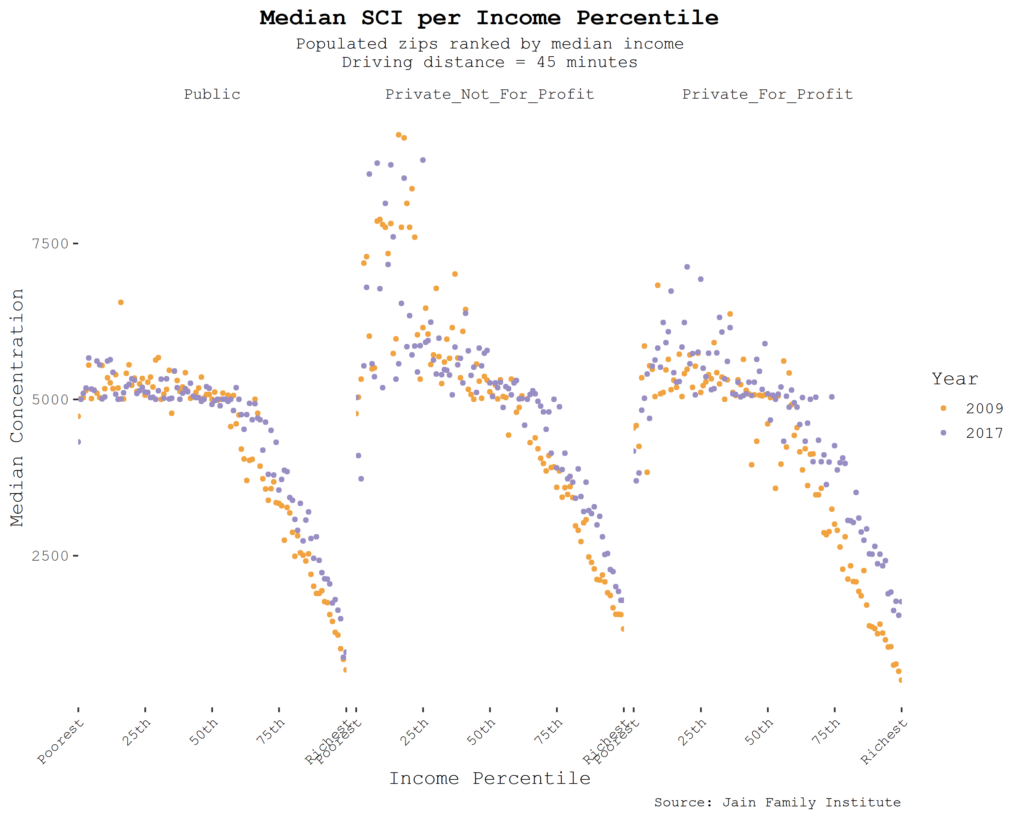
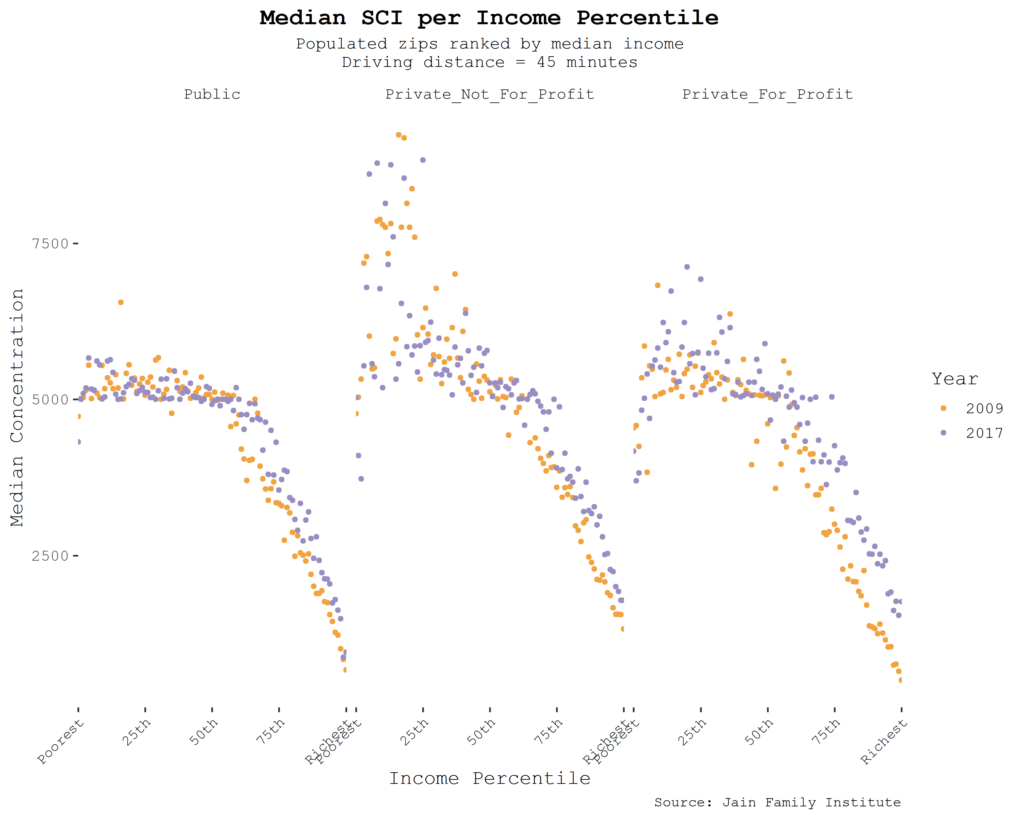
    Splitting up zip codes according to where they lie on the US income distribution also reveals interesting and persisting patterns. Richer zip codes are subject to lower higher ed concentration, but by 2017, even the richest zip codes are experiencing more concentrated higher ed markets, likely to worsen as the markets contract further after 2020.

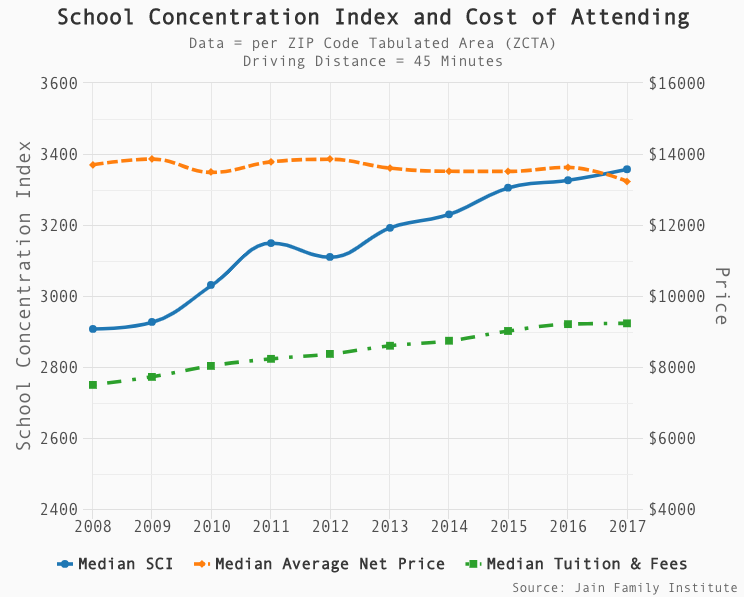
    As concentration has risen, so have prices—both tuition and fees as well as the “net price” of attendance, including financial aid and additional costs such as housing. This too is caused by the gradual withdrawal of state aid and the de facto privatization of much of the higher education landscape to look more like the for profits—subsisting on tuition, and designed to proliferate costly degrees would-be students feel pressured to obtain.

    Time series of SCI, tuition and fees, and net price, across zip codes over time.2

    Regression Analysis

    We can interpret the time trends in part because we already know a good deal about the trajectory of higher education policy, enrollment, and attainment, as well as broader economic conditions. But to isolate the effect of local school concentration, we undertake a further regression analysis.

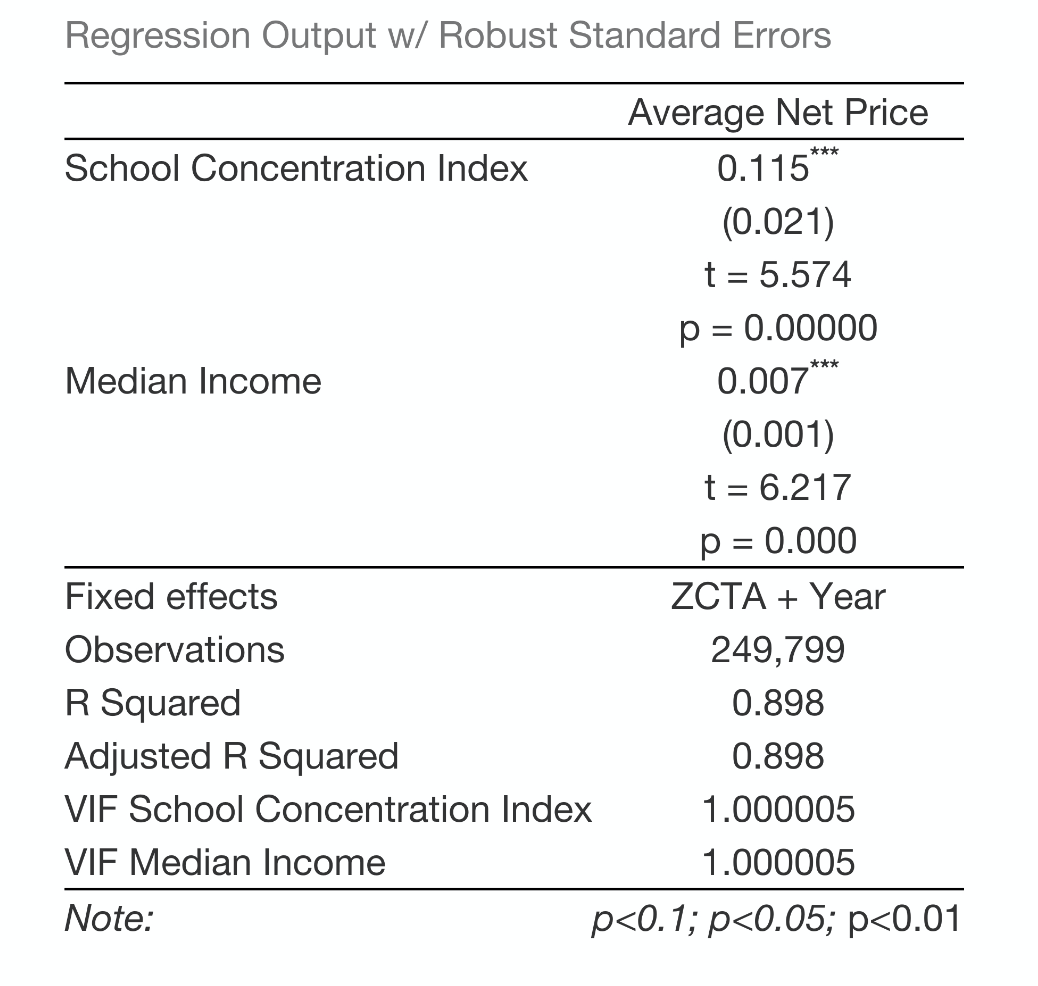
    Specifically, our level of observation is the zip code. We attribute higher education-related variables to zip codes using the concept of the driving distance, and we obtain demographic and economic data on zip codes from the American Community Survey. We are thus able to ascertain if there’s a relationship between the school concentration index and the cost of attending college, by zip code, conditional on controls. We use a two-way “fixed effects” specification to filter out both static zip-code level effects (which might include things like urban versus rural as determinants of both concentration and, potentially, cost of attendance) and a time trend (which would filter out the aggregate dynamics referred to in the previous section). We also control for zip code median income (which can vary over time and so is not redundant with the zip code fixed effect). The idea is that remaining within zip code, over-time variation in SCI and cost of attendance would be unlikely to be driven by some omitted variable, though of course, that assumption is highly contestable.

    In this analysis, we find there’s a residual positive relationship between concentration and cost of attendance: people in zip codes with fewer institutions pay higher prices, conditional on those controls.

    Regression output.3

    Regressions of price on measures of concentration have a fraught history in the literature on Industrial Organization, the branch of economics that deals with firms, markets, and industries. The question is how to interpret findings like the one we have in this case: more concentrated markets have higher prices. Is that because the (fewer) firms in those markets have greater market power and can use that power to set prices in the absence of competition? Or do firms that achieve higher market share do so because they are more appealing to consumers, and can therefore “get away” with charging higher prices? Higher education likely falls into the category of differentiated goods, in which firms (in this case, colleges and universities) are offering something unique to the public and are therefore not necessarily directly in competition with each other, although if a firm sets too high a price, its customers might be induced to switch to another. Industries with differentiated goods are typically thought to have some amount of market power—the question is whether higher concentration means those industries are less competitive, or more competitive (and to the victor go the spoils, so to speak).

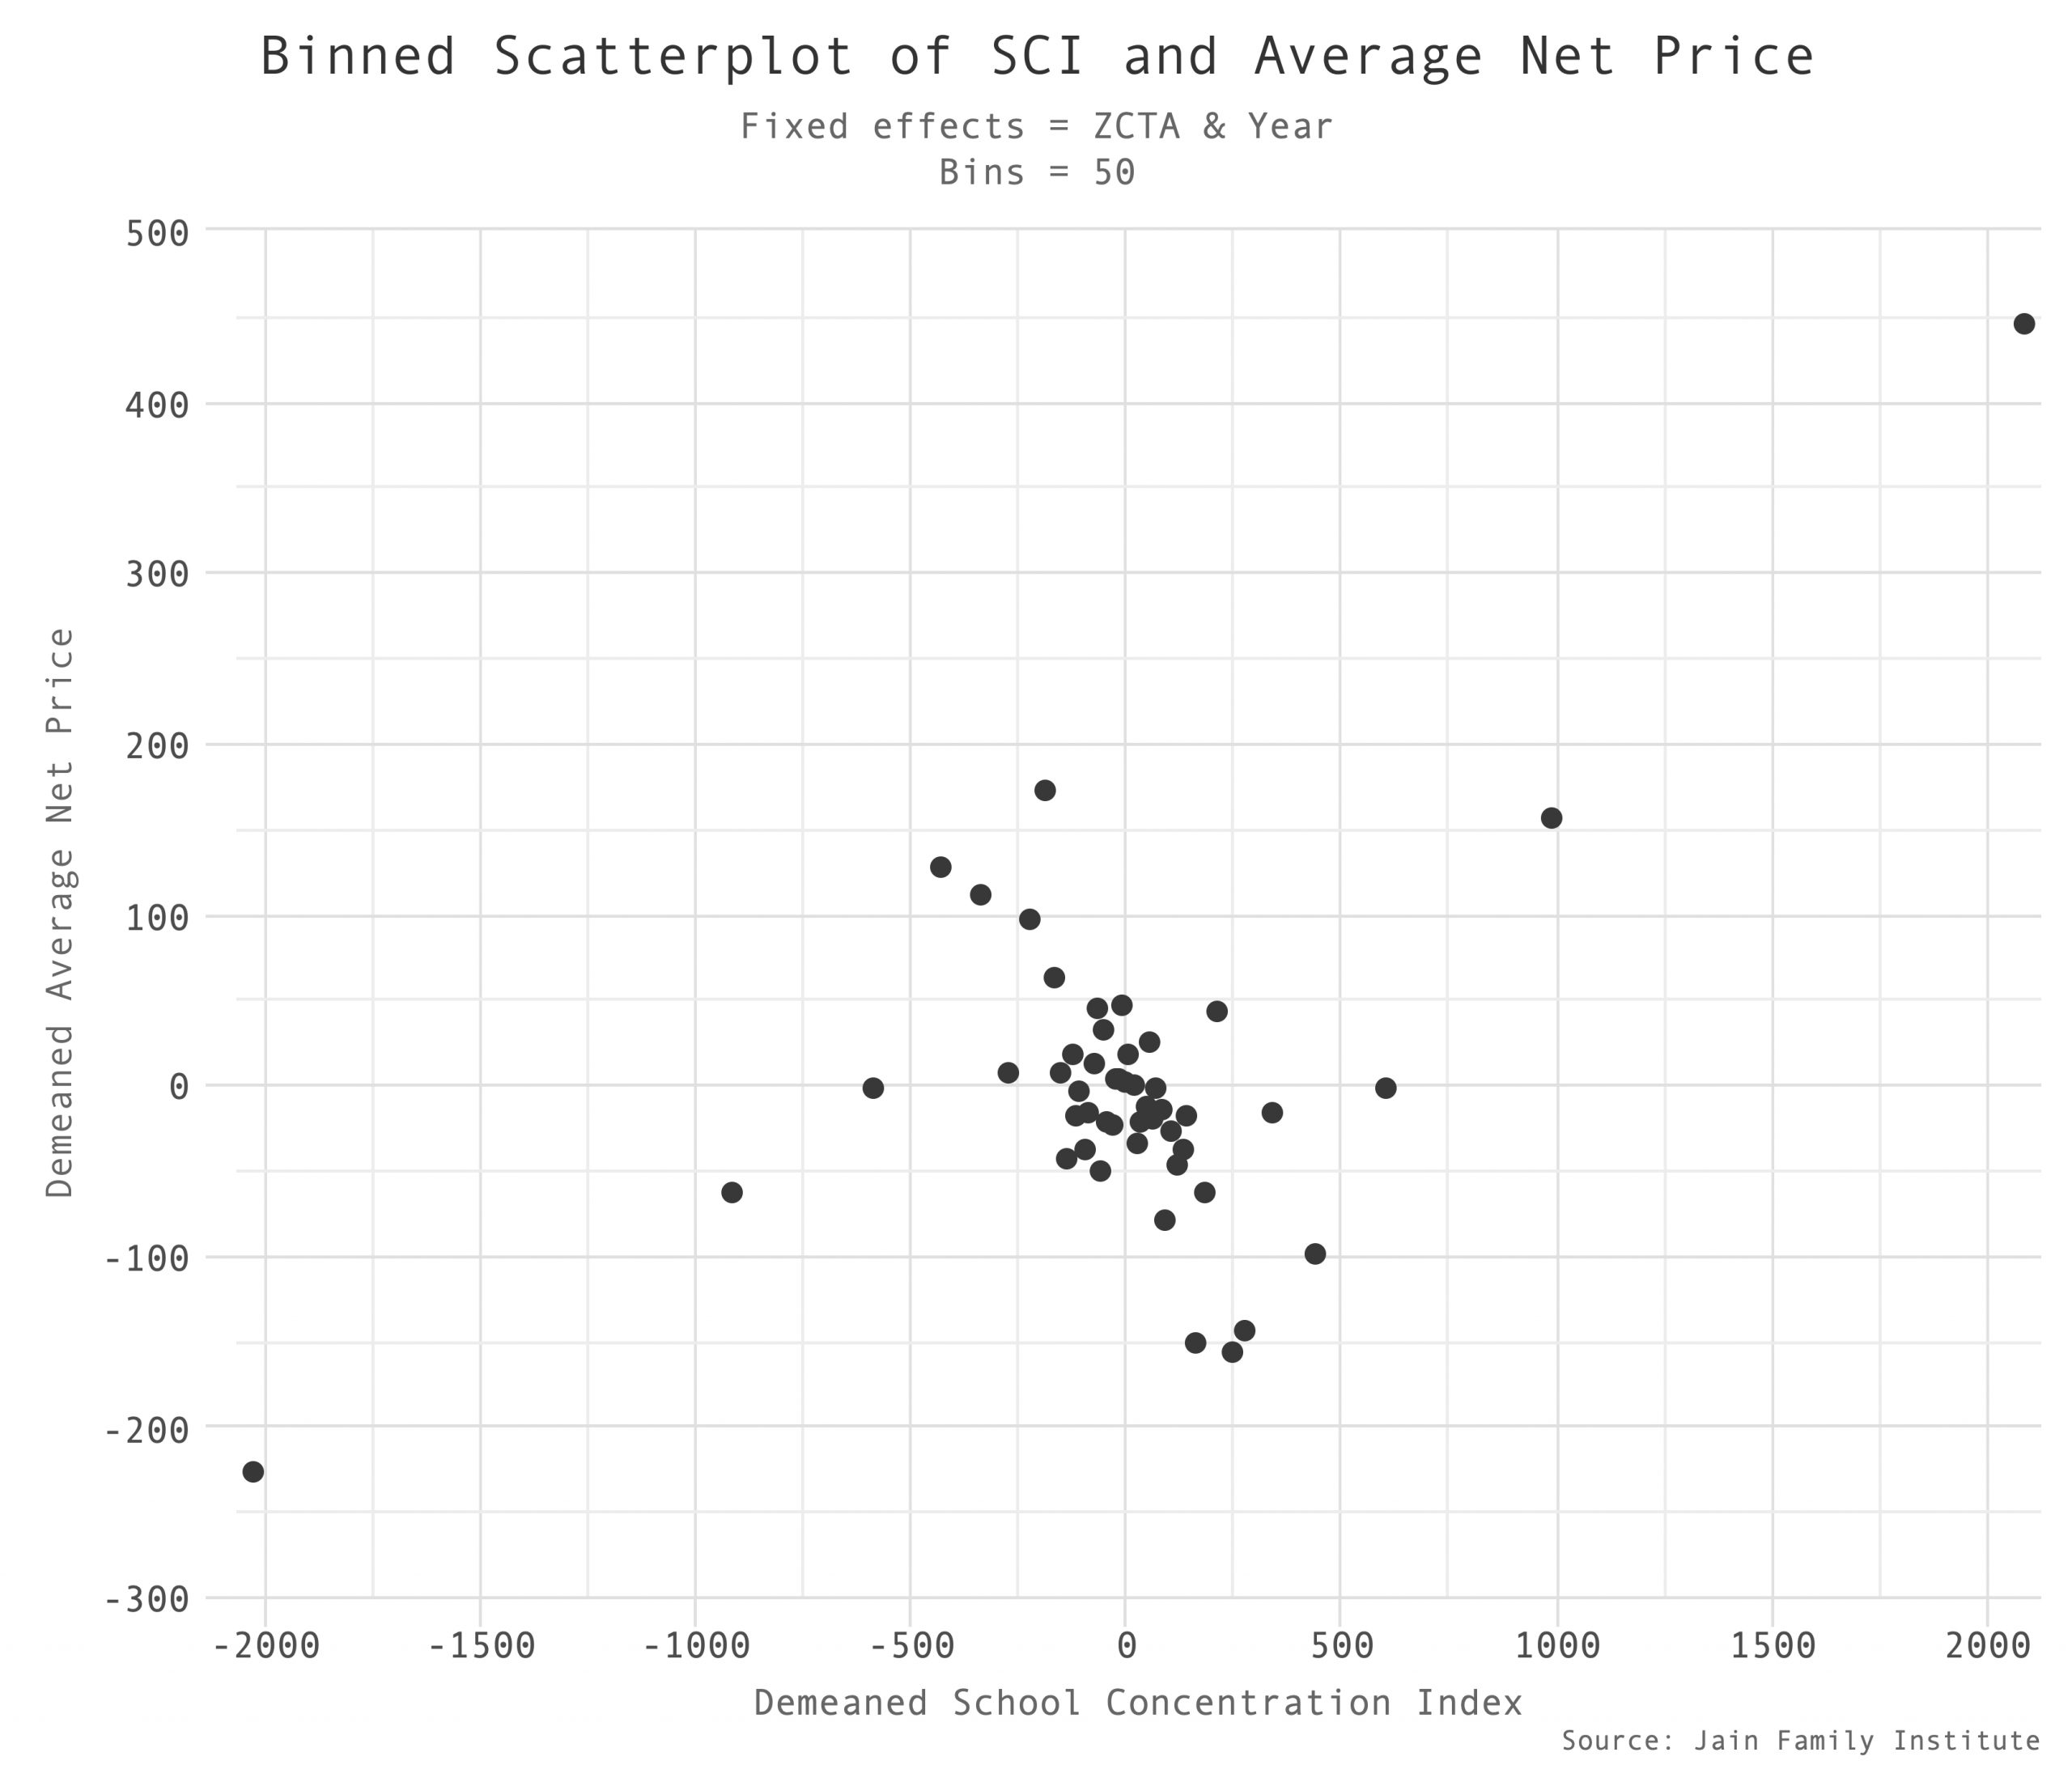
    Binned scatterplot of average net price on SCI.4

    One way we know there’s significant market power in higher education is the enormous degree of price discrimination. Relatively few students pay sticker price, and most are given a financial aid package that is tailored to them and their circumstances and therefore not available to another student. (Among other things, one student can’t “sell” their financial aid package to another.) Colleges most certainly tailor their offers to their assessment of how likely a given student is to be able and willing to pay a given level of tuition. Colleges typically present this price discrimination in egalitarian terms: students who are more able to pay pay more. But the reality is that students with fewer alternatives pay more—and those students are, in fact, the disadvantaged ones. The overall disposition of financial aid policies has shifted from the egalitarian to the discriminatory as part of the overall trend toward privatization, as evidenced by declining enrollment by students from more disadvantaged backgrounds at the state flagship institutions that were historically the most conducive to social mobility of any portion of the higher education landscape. Institutions are less in the business of redistributing higher education from rich to poor than they are in the business of charging what the market (and each customer) would be willing to pay for a given degree, and to induce them to buy more degrees at higher prices.

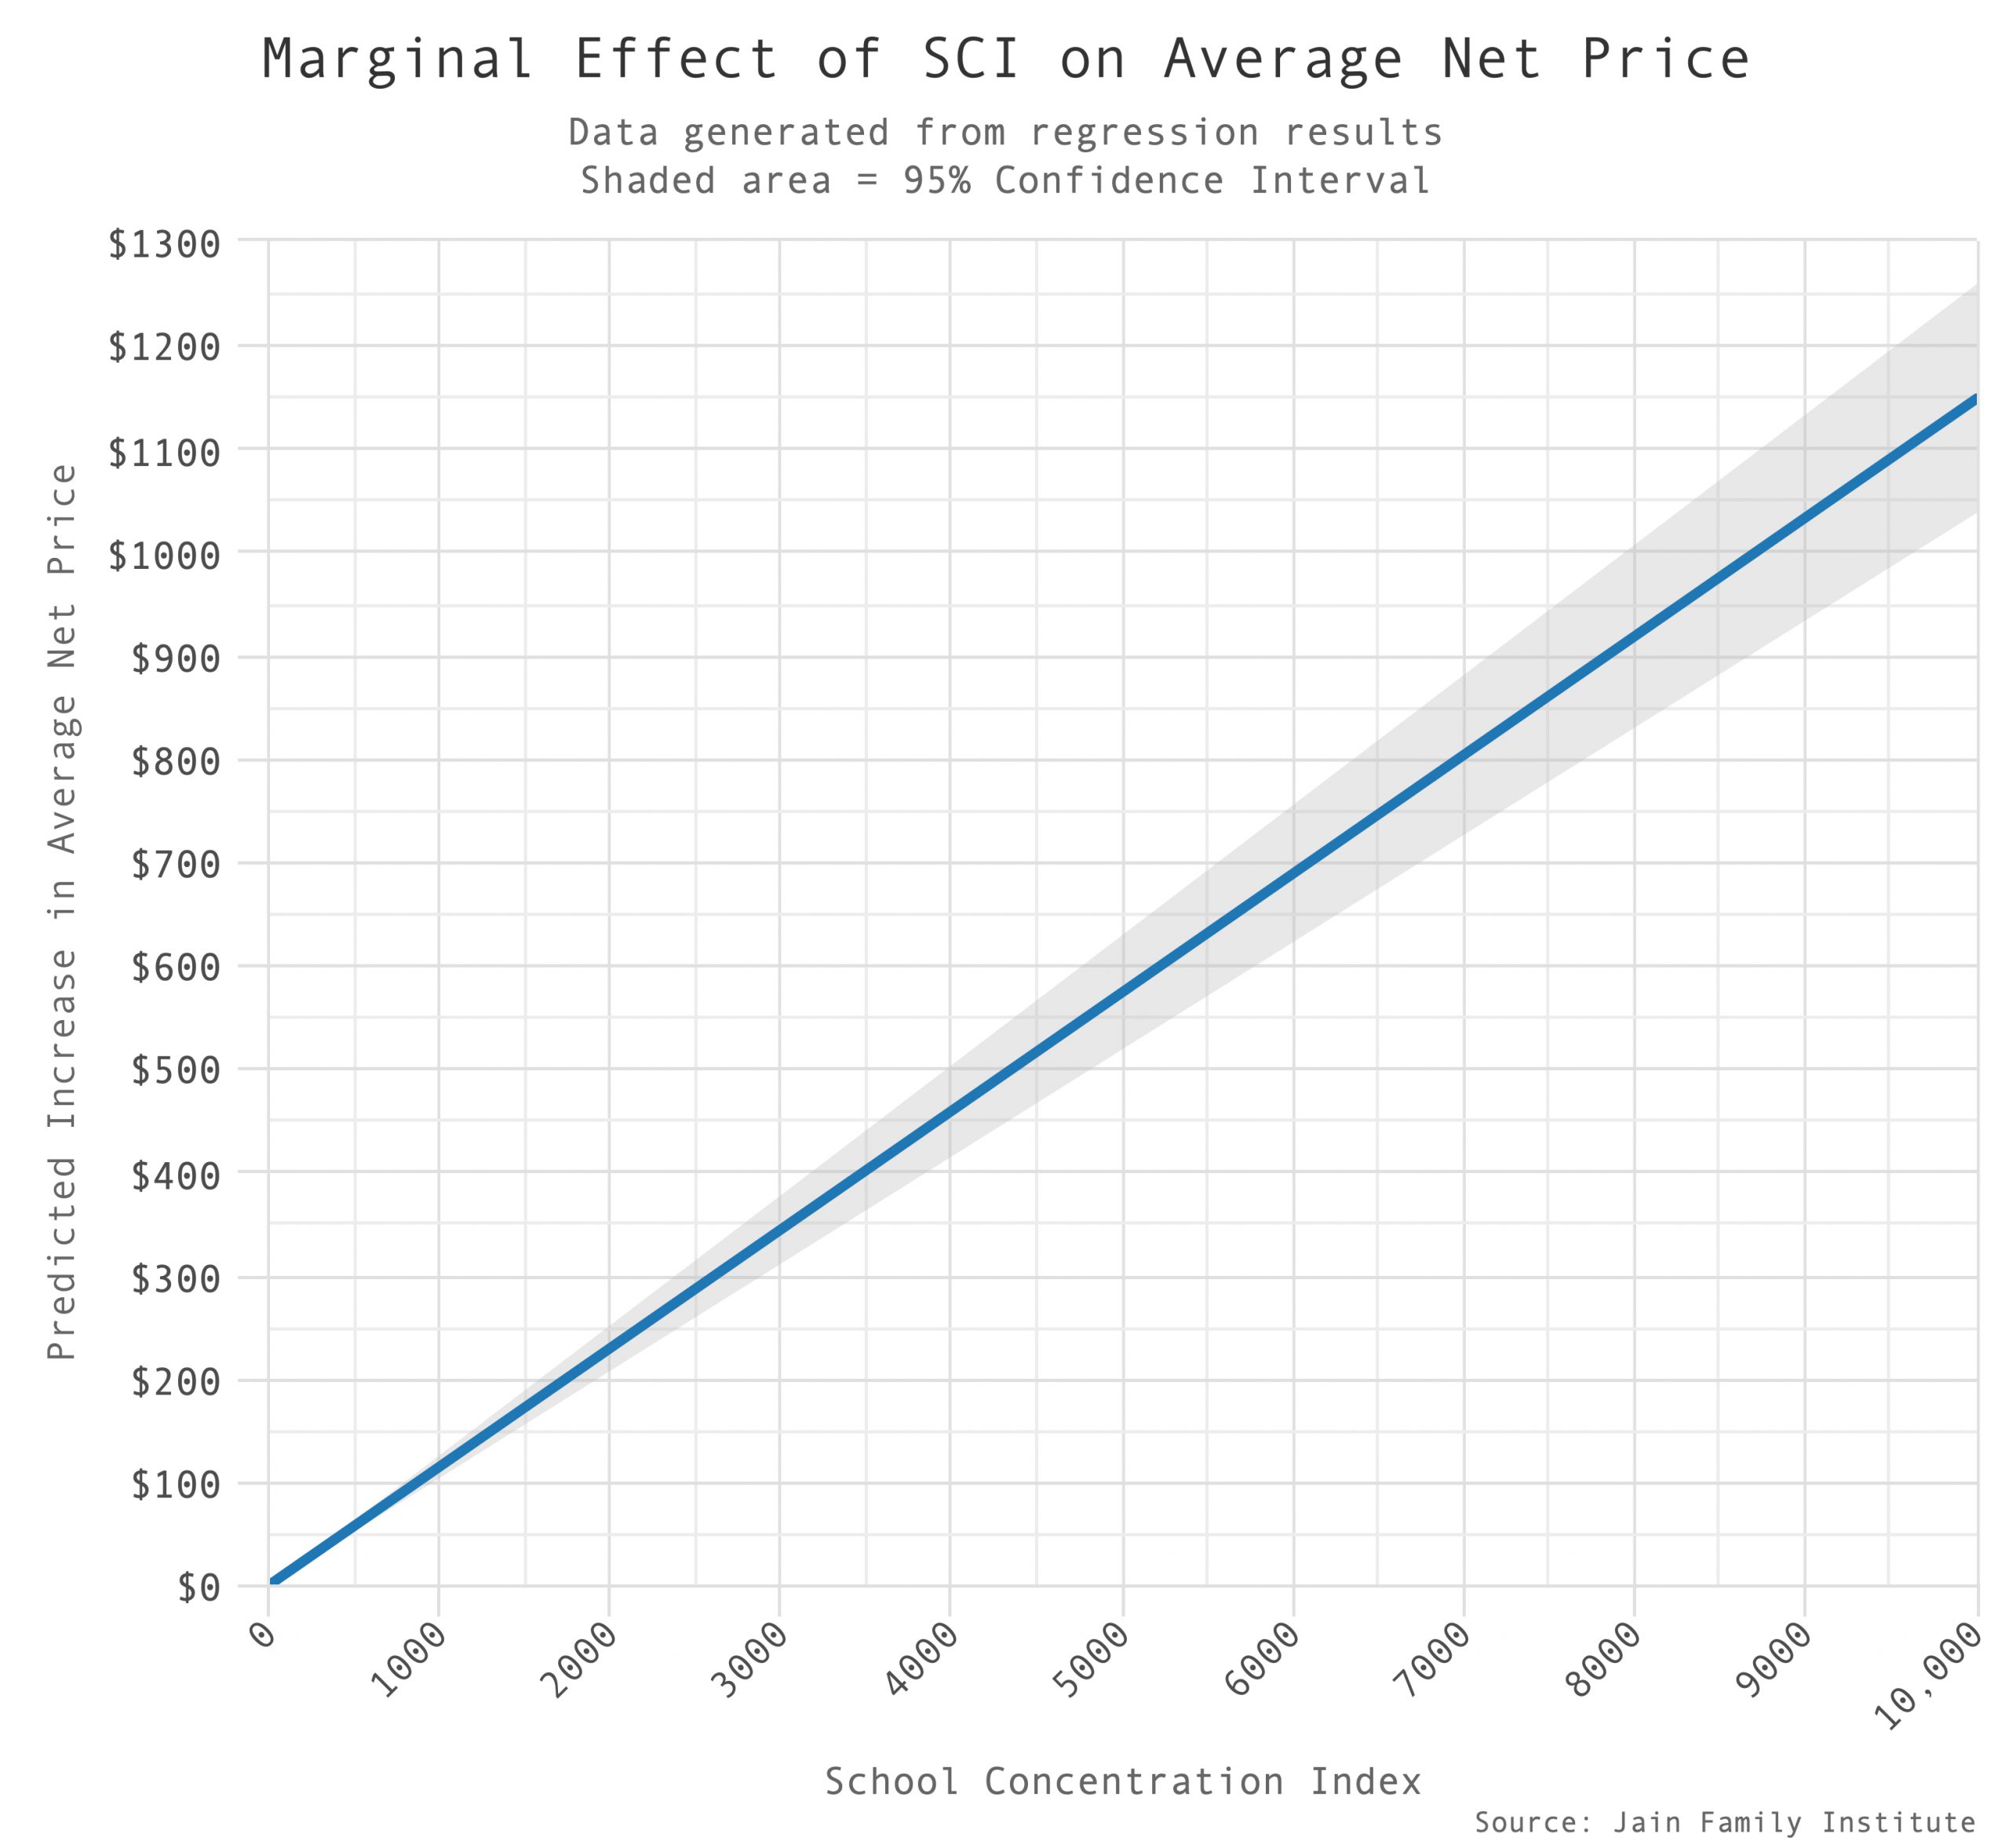
    Marginal effects analysis of the previous two way fixed effects regression.5

    All of this suggests that market power in higher education is an important and under-studied phenomenon. Here we present a fairly crude measure of market power—school concentration—that nevertheless appears to be at least correlated with outcomes we’d expect it to be. We can thus go one (small) step further toward interpreting the time trends we started with: concentration is increasing, and so are prices. The one may have something to do with the other.


    1. It bears noting that the chart lists speeds as reported by telecoms to the FCC. Numerous reports, including one by Broadbandnow, estimate that actual speeds are in fact much lower, averaging 25Mbps in rural areas and 100Mbps in urban areas. Another recent report by Microsoft found that 157 million people “do not use the internet at broadband speeds.” Even with the possibly inflated telecom-reported numbers, we can see a negative relationship between school concentration and internet quality. ↩
    2. This figure shows that as state funding for higher education declines (on a per student basis) and the previously-booming for-profit sector has diminished, concentration and tuition and fees are increasing, while net price is approximately constant. Traditional non-profit institutions have figured out how to expand enrollments on a for-profit-like, tuition-heavy business model, increasing concentration. The constant net price is probably driven by two dueling trends: rising prices at traditional institutions, and declining enrollment at historically more expensive, for-profit institutions. ↩
    3. Two-way fixed effects regression of average net price on concentration, zip code median income, and zip code and year fixed effects. The estimated coefficient on concentration is positive, indicating that zip codes that are more concentrated, on average, face higher net prices. ↩
    4. Includes the controls for zip code ID, zip code median income, and time. This depicts the regression output graphically. ↩
    5. This chart is to be read as follows: According to our estimated relationship between zip code SCI and average net price, increasing SCI from 0 to 10,000, i.e. the entire range, would be associated with increasing average net price by about $1150. The shaded gray area depicts error bars around these estimates. ↩
  5. Digital Scab, Digital Snitch

    Comments Off on Digital Scab, Digital Snitch

    Before Covid-19 hit, we’d become used to reports about Amazon’s robotics innovations and the impending large-scale automation of warehouse jobs. But recent strikes and protests by Amazon’s very human workers have exposed how far we are from robotic warehouses. In fact, as part of its effort to keep its warehouses fully staffed during the crisis, Amazon recently announced that it is ending its recently-instituted sick leave and base pay expansions, replacing both with increased overtime pay. While higher pay encourages more workers to apply for jobs, overtime incentivizes existing workers to work longer hours. Amazon’s strategy for increasing output in the pandemic seems to be getting its human employees to work harder.

    In late-February, I took what must have been one of the last public tours of an Amazon warehouse in Edison, New Jersey. Prepared to witness vast and impressive automation, I was met instead by a traffic jam of workers exiting the facility. Inside, there were of course robots—shelving units known as “pods,” whizzing stuff from one end of the warehouse to the other—performing tasks previously done by people with forklifts. (According to Amazon, these robots have raised productivity of the remaining workers by orders of magnitude.)1 But there were other innovative technologies on view, at the workstations of human “stowers,” who distribute incoming products to the pods, “pickers,” who take items off the pods to fulfil orders, and “packers,” who put the orders in boxes and tape them shut. Over their shoulders, there were clocks counting down how much time each worker had to complete each task. The technology tracks which workers fall behind, and learns how hard it can push them. In place of a human foreman, Amazon’s timers dictate the pace of work and mete out automated discipline.

    In the folk legend of John Henry, the eponymous protagonist works himself to death trying to match the pace of a steam-powered hammer that has automated his job away. From John Henry’s perspective, the steam hammer, a lower-cost substitute for his own labor, was a mechanical scab. Much of the current attention to automation, AI, and the so-called “future of work” reflects the fear of John Henry’s fate. But the focus on these mechanical scabs obscures the rise of a high-tech update to another traditional enemy of workers: the company snitch.

    US firms increasingly surveil their workers through digital tools. The Marriott hotel corporation, for example, tracks how long it takes housekeepers to clean a room via an app that gives the employer real-time data on the worker’s location in the hotel.2 Restaurant corporations like McDonald’s process data from cash registers to track exactly how long it takes workers to complete an order. And warehouse workers, like those at Amazon, wear devices on their bodies that track their movements around the warehouse. A 2018 survey by Gartner found that 22% of firms worldwide use employee-movement data, and 17% monitor computer usage data.3

    These technologies affect workers and the broader economy differently than automation. Where Amazon’s pods replace humans with stronger and faster machines, workplace surveillance technologies raise profits through a cruder mechanism: they push each employee to work harder, striving to convert every possible second into a peak.

    Given these developments, a Marxian analysis may be too kind to twenty-first century capitalism, which is failing to deliver the automation-driven productivity increases Marx predicted. Raising productivity through labor-saving capital investments, Marx believed, was key to the eventual shortening of the working day and the alleviation of human drudgery. In Marx’s periodization of the progress of industrial capitalism, he described how early, technologically unsophisticated capitalists garnered their profits through the brute extraction of more effort through the lengthening of the work day.

    Restrictions on the length of the working day limited the effectiveness of this brute force means of raising profits. To compensate for shorter work days, capitalists turned to two alternative strategies: effort intensification and automation. Focused on achieving “a more perfect means of exhausting the workman,” the effect of effort intensification on output was limited by the stamina of its human workforce.4 But through automation, capitalists found a supplement to wringing diminishing increments of effort from the workforce: labor-saving, productivity-increasing capital investments. Marx noted that automation “rais[ed] the productive power of the workman, so as to enable him to produce more in a given time with the same expenditure of labor [emphasis mine].”5 As automation spread throughout the economy, a general increase in productivity allowed capitalists to not only increase their own profits, but also, by cheapening the cost of food and other necessities of their workers, created the conditions for increased working class living standards as well.

    While limitless increases in raw effort are impossible due to the biological limits of human workers, the possibilities of labor-saving innovations are in principle infinite—the rising tide of productivity growth can “lift all boats” and make us all richer, even if some workers, like John Henry, suffer wage losses as they are replaced by machines. Cheaper goods, in turn, allow workers to spend more of their paychecks on new products, raising employment and wages in other sectors of the economy.

    Compared to automation, squeezing effort from workers is a rather poor method of increasing output. However, responding to the profitability crisis of the 1970s, corporations have been particularly enthusiastic about disciplining labor and maximizing the extraction of effort. Institutional changes in capitalism have encouraged this, and falling job security in the final decades of the 20th century meant increased authority for managers. In the late David M. Gordon’s phrasing, post-1980, worker effort came to depend on “legions of stick wielders” in management.6

    Technological developments in computer processing power, the World Wide Web, and GPS arrived in the stick-wielding era of labor management. As MIT economist Lester Thurow put it in 1992, new information and communications technologies meant that “bosses could do a lot more bossing.”7 These capabilities have only increased in the decades since, with the invention of biometric and algorithmic management technologies that allow bosses to process ever-increasing amounts of worker data in real-time. For example, domestic worker platforms like Handy and TaskRabbit collect location data on when a worker arrives at and leaves a job, while also quantifying previously difficult-to-measure and subjective performance information with customer reviews.8 As the economists Peter Skott and Frederick Guy have shown, worker surveillance technologies are “power-biased,”9 in that they improve managers’ information about worker effort levels. High-tech snitches allow managers to squeeze more effort from workers for the same level of pay, raising profits even if the new technology has no effect on technical efficiency. They extend the logic of stick-wielding, rather than labor-saving.

    Profitability was restored to capitalist firms after 1980 not through rescuing productivity growth from its post-1973 doldrums, but by redistributing income from workers to executives and investors. While wages stopped rising with labor productivity in 1980, productivity growth itself has been rather anemic. In fact, nonfarm annual productivity growth since 1980 has not come close to matching its 1947-1973 average of 2.8 percent.10 Moreover, things have been historically bad since the 2007 financial crisis, with annual productivity growth plunging to 1.3 percent.11 If there is a robot revolution, it isn’t showing up where one would expect to see it—in the productivity statistics.

    It is notoriously difficult to measure worker effort levels outside experimental settings. But official US statistics measure productivity by the amount of output produced per worker in a given unit of time, lumping together technologies that raise output for a given level of work intensity with technologies that simply raise work intensity. The important distinction between working more efficiently and working harder is invisible.

    But a bias towards effort extraction rather than automation would look something like the current pattern—modest rather than surging productivity growth. And research from recent years suggests that digital snitches are having a major impact on work. For example, Gutelius and Theodore at the University of Illinois have presented evidence showing that while technological change in warehouses has introduced some automation, effort intensification and finer-grained algorithmic management of workers have had the more powerful effect.12 Meanwhile Lazear, Shaw, and Stanton, analyzing data on individual worker productivity from a large firm that tracks the output of each individual worker by computer, found that most of the increase in productivity during the years 2006 to 2010 was from increased worker effort. Moreover, effort was higher when local unemployment rates increased, suggesting that worker surveillance tools and the threat of unemployment complement each other—the stick becoming more powerful as workers feel more precarious.13

    The rise of digital snitches represents a return to crude, early nineteenth-century models of labor discipline. Rather than enhancing or complementing the skills of workers, or relieving drudgery by automating boring or physically taxing tasks, surveillance technologies help firms squeeze out small, additional increments of effort. Instead of investing in training, or motivating workers with high wages and promises of future raises and promotions, companies rely on intense monitoring and the threat of dismissal. While Amazon workers may fear losing their jobs to robots, a message posted to the warehouse’s digital employee suggestion box, visible in the lobby of the New Jersey facility, expressed a different concern: “piensan que trabajan robots aqui.” They think robots work here.


    1. Noam Scheiber, “Inside an Amazon Warehouse, Robots’ Ways Rub Off on Humans,” The New York Times, July 3, 2019. ↩
    2. Juliana Feliciano Reyes, “Hotel Housekeeping on Demand: Marriott Cleaners Say This App Makes Their Job Harder,” The Philadelphia Inquirer, July 2, 2018. ↩
    3. Ellen Sheng, “Employee Privacy in the US Is At Stake as Corporate Surveillance Technology Monitors Workers’ Every Move,” At Work, CNBC, April 15, 2019. ↩
    4. Marx, Capital, Vol 1., Chapter 15, Section 3(c). ↩
    5. Marx, Capital, Vol 1., Chapter 15, Section 3(c) ↩
    6. David M Gordon. 1996. Fat and Mean: The Corporate Squeeze of Working Americans and the Myth of Managerial ‘Downsizing.’” New York: The Free Press, 66. ↩
    7. Lester Thurow. 1992. Head to Head: The Coming Economic Battle Among Japan, Europe, and America. New York: William Morrow, 171.  ↩
    8. Alexandra Mateescu and Aiha Nguyen, Algorithmic Management in the Workplace (Data & Society, 2019). ↩
    9. Frederick Guy and Peter Skott, “Power, Productivity and Profits” (2007). Economics Department Working Paper Series. ↩
    10. Official productivity growth briefly averaged 2.7 percent from 2000 to 2007, but a team of economists led by Susan Housemen at the Upjohn Institute showed that this was largely driven by an idiosyncrasy in how government statisticians accounted for quality improvements in the computer industry. Strip out computer manufacturing, and productivity barely budged. ↩
    11. Bureau of Labor Statistics, “Productivity change in the nonfarm business sector,” Labor Productivity and Costs. ↩
    12. Beth Gutelius and Nik Theodore, The Future of Warehouse Work (UC Berkeley Labor Center, 2019). ↩
    13. Edward P. Lazear, Kathryn L. Shaw, and Christopher Stanton. 2016. “Making Do with Less: Working Harder during Recessions.” Journal of Labor Economics. ↩
  6. The Class Politics of the Dollar System

    Comments Off on The Class Politics of the Dollar System

    The global dollar system has few national winners. In the typical frame, understanding the US dollar means understanding the “exorbitant privilege” it confers on America. But the role of the dollar in structuring the international financial system and defining the relationship between a hegemonic US and the rest of the world is ambiguous—as is the question of who exactly benefits from the current arrangement. Dollar primacy feeds a growing American trade deficit that shifts the country’s economy toward the accumulation of rents rather than the growth of productivity. This has contributed to a falling labor and capital share of income, and to the ballooning cost of services such as education, medical care, and rental housing. With sicknesses like these, can we say for certain that the reserve currency confers substantial benefits to the country that provides liquidity and benchmark assets denominated in that currency?

    For the rest of the world, the ills are clear enough. In developing countries, the need to insure their economies against currency crises and debt deflation has meant the accumulation of dollars at the expense of necessary domestic investment. These policies are usually accompanied by a suppression of consumption and incomes to establish a permanent trade surplus vis-à-vis the dollar system. And in many countries, the dollar system allows corrupt elites to safely transport their ill-gotten earnings to global banking centers located in jurisdictions with opaque ownership laws.

    A closer look at the underlying dynamics that sustain this arrangement reveals why seemingly no one wants to “buck the dollar” but why all countries, including the US, have an interest in doing so.

    Rather than viewing the dollar system as primarily a national tool of the United States government, we should understand it as a consequence of a globalized economy that privileges the preferences of financial elites for the free, international movement of capital. The system rests not on uniformly active support for the dollar as a global currency, but on the absence of robust international monetary governance and accommodations to international money markets. The dollar’s present centrality does not come from the priorities of United States national security interests. Rather, it is rooted in the preferences of private actors in the global money market that mediates between financial institutions, political and business elites, and states. Traditional views of Westphalian sovereignty are not sufficient to explain the cleavages caused by the dollar in the “matrix” of interlocking balance sheets that make up the global financialized economy. While the dollar system has undoubtedly had a disproportionately negative effect on developing countries, the main fault lines that emerge from the dollar system are along class, rather than national lines.

    In this context, it might be tempting to retreat to national boundaries and to advocate for de-globalization of various kinds. However, the fact that the dollar system is primarily based on social, rather than geopolitical conflict means that the best solutions suggest at a reform of the system in a manner that empowers people at the bottom of the global social hierarchy.

    The contours of the dollar system

    The global accumulation of wealth and payments for trade and other transactions are largely denominated in dollars, making it the dominant currency for credit and invoicing. Because most of the entities operating in this system do not fall within the purview of the Federal Reserve, most dollars are supplied via offshore interbank credit, funded by dollar deposits at non-US banks, or “eurodollars.” These offshore transactions require safe, dollar-denominated collateral to manage their liquidity—preferably United States Treasury debt. Zoltan Pozsar has long highlighted this feature of the offshore financial plumbing, warning of a “black hole” in the dollar funding market. Offshore dollar pools depend on the liquidity of treasuries and near substitutes as collateral to raise cash in the event of a margin call.

    The reason for these dollar pools is twofold. First is the need to fund trade. The Eurodollar system facilitates trading relationships between countries with different currencies by giving them access to a common stable currency in which to denominate trade—the dollar. Dollar credit allows the execution of contracts without actual, US-issued currency being exchanged. Instead, the system functions as an exchange of IOUs to deliver receipts at various periods of time. Banks in major money centers clear this system of credit using a combination of time accounts and, if necessary, repurchase agreements to obtain dollars via short-term loans typically collateralized by US treasury debt.

    Because 80 percent of trade in emerging market economies is denominated in dollars, firms with receipts in a domestic currency acquire unsustainable debt in dollars if the domestic currency falls. For this reason, central banks attempt to stockpile dollar assets, most commonly US debt. To acquire them, they usually run a persistent trade surplus by repressing the real wages of their workers. This might be sustainable in the short run, but in the long run it leads to periods of economic stagnation, or international trade and currency wars.

    The second driver of these offshore dollar pools is wealth inequality and outsized corporate returns. Large corporations, pension funds, and extremely wealthy individuals cannot bank their money in the retail banking system. Instead, they hold them in pools of dollar liquid denominated assets that can be converted into dollars quickly. While this “shadow banking” system has legitimate uses, it also facilitates tax evasion and kleptocratic corruption. The repression of real wages only compounds this trend. Ubiquitous global trade imbalances drive more returns to owners of capital, increasing inequality.

    The dollar system thus facilitates and fuels the power of elites who have an interest in maintaining the status quo. A globalized system with a dominant key currency aids the accumulation of rents at the expense of higher consumption from workers in exporter countries and the hoarding of those rents in the legal black hole of offshore finance.

    A financial Dutch disease

    The fracture between elite beneficiaries and working losers under the dollar system exists within the United States as well. The US suffers massive negative economic consequences from its position as issuer of the dominant reserve currency—the effects of which are unevenly distributed. Demand for high quality dollar-denominated assets saddles the United States with a financial “Dutch Disease”; a situation in which the reliance on exporting a single commodity raises the exchange rate and thus squeezes out the production of tradeable, value-added goods in favor of services and financial rents. Classic examples of countries where ‘Dutch disease’ has taken place have usually been commodity exporters such as Holland in the 1970s (after the discovery of North Sea Oil) as well as Nigeria and Russia. Dutch diseased economies often result in a shrinking, narrow elite whose power rests on income from sales of the single commodity, or the services and management that bloom around the cash flows generated by this commodity.

    For the United States, this single commodity just happens to be the dollar. The mechanism behind this process is not hard to understand. From the point of view of simple accounting, every asset must be matched by a liability. That means that a surplus on the capital account—or the desire of the world to purchase safe, US dollar-denominated, assets—is offset by a deficit on the current account. Thus, the United States budget deficit and its trade deficit are both endogenous to the dollar system. When US budget deficits fall either as the result of an increased trade surplus, or the cutting of the budget, financial risk increases as markets substitute safe US government debt for risky collateral, such as the infamous mortgage backed securities of the 2008 crisis.

    The most visible cost of the disease is the steady appreciation of the dollar since the 1980s, despite a falling US share of global gross domestic product. The main domestic symptom has been the rising costs of non-tradable goods—such as medicine, real estate rents, and education—over tradable goods. This disconnect is at least in part responsible for the country’s low rate of inflation, falling wage share, and increased economic insecurity despite access to a wider range of consumer goods. While the American consumer can now purchase an ever expanding set of appliances, electronics, and small luxuries, services that are necessary for economic mobility and household sustainability are increasingly out of reach.

    It is hard to see how the US is economically benefiting from this system. In the early post-war years, it might have been true—in a narrow, arithmetic sense—that this arrangement was, economically, a net benefit for the United States. The cost of having a reserve currency was smaller after the war, simply because the non-US share of global GDP was considerably smaller than it is now. In the present, however, now that the American share of a larger pie is relatively smaller, the costs of the global demand for dollars are higher. Most other governments would, in fact, actively discourage substantial and sustained purchases of their currency.

    If this system is so sub-optimal, why is it still in place? The answer is that it is the locus of a new kind of transnational class politics.

    The class politics of dollarization

    Frameworks for understanding the persistence of the dollar system tend to vary from from reductionist to outdated, often examining international politics with discrete nation states as the main unit of analysis. In this view, the dollar is a product of hegemonic US interests, wielded as a tool of statecraft. But global financialization has upended this framework: elite interests are not aggregated domestically but internationally, and are transmitted via the balance-of-payments mechanism and the financial system. US leaders and technocrats do not directly compel developing countries to invest their balance-of-payments inflows into Treasuries; nor is it really the active decision making of, say, the People’s Bank of China that’s led to the accumulation of Chinese dollar reserves.

    Let us assume that Chinese authorities wanted the People’s Bank of China to reduce its dollar holdings. In order to resolve their external imbalance with the US, they would need to resolve their domestic imbalances. That is because basic accounting identities hold that everything not consumed domestically is saved; those savings are then “exported,” largely to the United States, in the form of capital flows. As Michael Pettis has consistently argued, the low household share of income in China (high levels of income inequality caused by rapid growth) have led to a high domestic savings rate and underconsumption. Too great a share of the national income is in the hands of high-saving entities with dollar liquidity preferences, such as high net worth individuals and large corporations. To reverse this imbalance, income would have to be transferred from these powerful interests to China’s workers—a dynamic described by Albert Hirschman as early as 1958. Barring a drastic redistribution of income, perhaps the People’s Bank could simply seek out another reserve currency and an equivalent safe asset. But neither of these would be forthcoming, since no country other than the US has deep, liquid markets in a benchmark asset.

    The implicit assumption here, however, is that the financial sector and corporate elites actually want an alternative. There is no reason to believe that this is the case. The system, as it is constituted, does not have many disadvantages for current entrants, and any alternative would require a distributional shift. China’s vast dollar reserves illustrate how emerging market economies with domestic imbalances caused by years of lopsided growth can use dollar-denominated assets as a politically convenient method of maintaining growth without having to resort to intersectoral transfers—from, say, profits to wages. Developed world exporters like Japan and Germany also maintain a growth model based on cost competitiveness and wage suppression. An increased role for the Euro or the Yen would undercut these models. For resource exporters, it facilitates corruption and tax evasion through simple capital flows. In the United States, it benefits financial industry elites, who can reap the rewards from intermediating capital inflows into US markets, while the cost of non-tradable services like tuition, healthcare and real estate rises for everyone else. Across all countries, elites win.

    The preference of global elites, and therefore global markets, for the dollar system demonstrates the futility of applying a Westphalian framework to the global financial system. Herman Mark Schwartz, one of the foremost experts on the dollar and American hegemony, offers a better way to think about the dollar—namely, as the state money of a quasi-imperial global system, in which the different economic regions are tied together by a shared reserve currency. This “imperial currency” is more of a by-product, and less of an enabler of (or even an enabling constraint on) American expansionism and military adventurism, both of which preceded the reserve currency status of the dollar.

    Two clear geopolitical advantages accrue to the US because of its reserve currency status: dollar liquidity swap lines, and the dreadful power of American sanctions. But the ability of the US to wield that power has been built ad hoc, over several decades, and in periods of great contingency. Recent research shows the international dollar system was not purposely designed, but rather assembled by elites who believed that international money markets must not be actively structured toward a notion of the common good, but backstopped. The system of swap networks that we associate with the 2008 financial crisis had its origins in efforts to backstop the eurodollar as early as the 1960s, and a decision by leaders that it would be better to facilitate it than to fight or restructure it. As long as domestic inequalities are not resolved at the expense of these elites, the dollar will remain hegemonic.

    The source of the Federal Reserve’s power over the eurodollar system—and the vulnerability of emerging markets within it—is the global reliance on central bank backstopping. In the 2008-9 crisis, the Fed deployed so-called central bank liquidity swap lines to backstop the global system. These took the form of reciprocal currency arrangements between central banks: The Fed replenished the dollar reserves of other central banks in exchange for local currency. The real power of the swap lines is not who gets them but rather who doesn’t. In a recent piece for the Nation, Andres Arauz and David Adler highlight how these swap lines can be used for a form of monetary triage, in which the United States decides which countries have better prospects for weathering economic storms. However, the Covid-19 crisis has thrown even this into doubt. Not only has the Fed extended its swap support to a wider range of countries than in 2008 and 2009, but on March 31, 2020, it opened a repo facility with foreign international monetary authorities (FIMA). The FIMA Repo Facility allows other central banks and other monetary authorities to directly exchange their Treasury securities for dollars, thereby avoiding having to sell their Treasuries outright into an illiquid market. In doing so, the Fed created an additional source of dollar liquidity for any central bank.

    Reforming the dollar system

    Dedollarization seems like a distant prospect. There is no equivalent euro-denominated safe asset, for instance, and capital markets in the eurozone are not as developed as those of the US. Attempts to deepen capital markets and introduce a common debt instrument have been dealt repeated blows by EU countries belligerently opposed to financial risk sharing. The recent scuttling of the ‘coronabond’ proposal provides ample testimony on this dynamic. As long as countries like Germany and the Netherlands remain firm in their opposition to necessary financial integration in the eurozone, the currency composition of international reserves will remain heavily skewed towards the dollar. The political prospects for creating Bancor, a synthetic currency first proposed by John Maynard Keynes, are equally bleak.

    Instead, we should opt for managing the current system to mitigate its harms, a process in which the United States must take a leading role. We have some proposals.

    First, the United States should offer its trade counterparties direct access to the Federal Reserve balance sheet via institutionalized swap lines that are part of trade agreements. The United States should give its partners access to high quality dollar liquidity in exchange for maintaining a balanced trade policy. This tradeoff would decrease the American trade deficit, while placing upward pressure on the real wage in trade counterparties.

    Secondly, as Nathan Tankus recently suggested, the Federal Reserve can extend its swap line to the International Monetary Fund (IMF). This would allow the IMF to act like a global fiscal policy maker by issuing so-called special drawing rights (SDRs). In their current form, SDRs are largely illiquid and cannot be converted into dollars or even other currencies in which emerging market debt is denominated. Providing swap line backstops to SDRs is a politically expedient way of using the institutions we already have to ensure that SDRs are actually redeemable in dollars. Tankus’ proposal has been advocated in a letter to the G20 signed by many world leaders under the leadership of former UK Prime Minister Gordon Brown.

    Thirdly, the United States should begin to view its deficit not as a problem but as a public resource, and to manage it like energy exporters use sovereign wealth funds to avoid Dutch Disease. To administer this public good, the US should establish a series of public banks to fund specific economic investment initiatives. The Federal Reserve would guarantee the debt of these institutions by discounting it at a penalty rate for reserves or United States Treasury debt or dollar reserves. These securities could thus trade at a slightly higher yield than treasuries and provide investors with an alternative product to general purpose treasuries. The liabilities of these investment vehicles would provide global collateral and promote financial stability while also offsetting the effects of dollar hegemony on domestic industry via permanent, active investment.

    But the right set of tools are not enough. To go beyond managing the status quo, we need to first recognize that the dollar system evolved not as a tool of imperial statecraft, but as the project of a transnational elite that has effectively usurped control of an international public good. As long as active confrontation with elite interests remains wanting, the dollar system will persist as a zero-sum game—a state of affairs that, in the long run, is unsustainable for the global political economy. And, following Herbert Stein’s quip: that which is unsustainable will not be sustained.

  7. Inside Out

    Comments Off on Inside Out

    Editor’s note: The author would like to acknowledge the work and influence of the Institute for Sustainable Futures, Professor Thomas Graedel, and in particular Professor Julie Michelle Klinger, whose essential book Rare Earth Frontiers undergirds much of the ongoing work and discussion on the politics of rare earth mining.

    The transition to a post-carbon energy economy will require extraction. As the sun set on the Bernie Sanders campaign, and with it the prominence of the Green New Deal in the contest for the presidency, the Trump administration issued an executive order encouraging private US exploitation of mineral resources in space. Whatever the shape of the coming transition away from fossil fuels, the need to understand the social and distributional costs of a changing energy infrastructure has never been greater. In a new report, I survey the state of minerals production, near-future ploys for extra-terrestrial mining, and the persistent externalities of extraction.

    Recent years have seen growing attention to the material requirements of information technologies, and especially to the social and environmental harms of sourcing rare earths and cobalt. Researchers highlight, for example, the dependence of electric vehicles and wind power infrastructure on rare earths, or batteries on lithium. But these discussions have tended to omit questions regarding the necessity of extraction, relying instead on a more familiar idiom of consumer and corporate responsibility. Both the Trump administration’s vision of celestial expansion and some visions of a post-carbon future depend, stated or not, upon a continuing regime of mineral extraction and outsourced harm.

    In the financial press, concerns around the ethics of mineral sourcing are accompanied by anxieties around supply security: are there enough of these so-called “critical” metals to sustain a complete zero-carbon energy transition? Are they abundant and accessible enough for such a transition to be economically viable? As one paper puts it, transitioning “from a fossil-based to a [renewable energy]-based system does not alleviate the problem of resource depletion, it merely shifts it from fuel to metal.”1 While predicting future demand is difficult, the general consensus is that the supply of several metals—such as cobalt, nickel, cadmium, copper, and tellurium—will need to increase substantially to accommodate a renewable energy transition. Predicting the resources (the total quantity available) and reserves (the amount that can be economically extracted) of a given metal is also imprecise, sometimes changing overnight by orders of magnitude as the price of a metal goes up or as new extractive or refining technology is developed. These patterns follow that of oil: turn-of-our-century predictions of impending “peak oil” seem silly at the end of a fracking boom that pushed oil extraction to an all-time high. Nevertheless, current predictions estimate that most metal resources will last at least a century, though some, such as copper, may be exhausted sooner.

    But more worrisome than questions of supply are the social and environmental harms of mining. Environmental impacts may include habitat loss, deforestation, high water usage, water and air pollution, soil contamination (in the US, metal mining is the greatest producer of toxic pollutants), and greenhouse gas emissions (10% of overall GHG emissions stem from the mining sector globally). Many of these effects are a result of regular mine operations, and standard mitigation infrastructure, like tailings dams, fails quite frequently. The results amount to a litany of devastation, like the 2000 Baia Mare tailings spill in Romania, dubbed “the worst environmental disaster since… Chernobyl”, and the 2015 Fundão tailings dam collapse that destroyed an entire village. At the time, the Fundão collapse was “Brazil’s worst ever environmental disaster”; that title now goes to the 2019 Córrego do Feijão tailings dam collapse. Just 90km from the Fundão tailings dam and owned by the same company (Vale), this disaster killed almost 300 people.2

    The damage of these projects long outlives their duration. Toxic leakages can continue for a century after a mine’s closure, and the remediation work that is supposed to follow comes with extraordinarily high costs which are often borne by the public. For a sense of scale: one mining area in Ganzhou, accounting for just over 8% of Chinese rare earth production, was estimated to have a remediation cost equivalent to 25% of the market capitalization of the five major Chinese rare earth companies—or 75% of all Chinese production.

    Areas designated as “protected” by governments and international conservation bodies, often including Indigenous lands and nature reserves, are supposed to be spared damaging effects. But mining concessions frequently overlap with protected areas,3 and even when they don’t, proximity can be just as damaging. Pollution doesn’t respect the boundaries of mining concessions, and neither does the infrastructure required for extraction—roads, processing facilities, and so on all contribute to deforestation well beyond the concession boundaries. In total, about a quarter of protected areas (in countries for which there is data) around the world overlap with or are within 1km of at least one mining concession.

    As demand for metal grows, we should expect these harms to worsen. While there appears to be enough metals in the ground to sustain anticipated demand increases, the dynamics of the industry are such that only the most profitable—that is, most accessible or highest in concentration—deposits are mined first, and over time, operations must dig deeper and/or process lower-quality ore, requiring more energy, water, and occasionally more toxic processing. One estimate suggests that the environmental impacts of copper could double or triple by 2050 because of this dynamic.4

    The distribution of these harms is also unequal. The Australian Lynas Corporation, the largest rare earths firm outside of China, operates the Mount Weld rare earth mine in Australia, but exports the most toxic part of the production cycle, ore processing, to Malaysia. Locals in Kuantan, the site of the processing plant, have resisted the project, arguing that its construction was a way for the firm to shift the environmental and health harms from the Australian public onto them. (In August of last year, the Malaysian government renewed its license to Lynas for the plant, citing the need to counterbalance China’s dominance in the rare earths market.)

    The race to the bottom in mining and processing shapes these dynamics. The Mountain Pass mine in California was once the world’s major producer of rare earths, accounting for 70% of global production until the early 2000s. The mine was eventually shuttered following environmental regulations and worries around its radioactive leakages. To fill the gap, the Chinese government expanded rare earth production, accepting the harms as an acceptable cost of economic growth. However, when China started imposing tighter quotas around rare earths due to environmental and health impacts, the US, Japan, and the EU—needing access to cheap rare earths but not willing to bear the costs themselves—summoned the World Trade Organization to rule against the quotas.

    The other harms of mining are myriad. One notable example is a 10-year civil war around the Panguna copper mine in Papua New Guinea, which resulted in about 20,000 dead. While conflicts are frequently on a smaller scale, they are no less violent. Mining activity encroaches upon resources that people require; in Chile’s Salar de Atacama, the “world’s driest desert” which also supplies one-third of the world’s lithium, 65% of the region’s precious water goes towards lithium production instead of the local population. Inadequate land rights allow mineral wealth to be monopolized by states and companies rather than those who live on the land. In Brazil, Indigenous land rights extend to only the top 40cm of the land; the federal government owns anything deeper and sells the rights to mining companies. Mining concessions are often extracted under duress as “sweetheart deals” that disproportionately benefit the mining entity, such as those signed in the Democratic Republic of Congo—now notorious for its horrendous mining conditions—immediately following its devastating wars.

    Growing concern around supply security has caused rich nations to rethink their dependence on others. In line with the rhetoric of energy independence that accompanied the shale oil boom, the US is now prioritizing domestic production of “critical metals” for national security goals. This shift has led to the reopening of the California Mountain Pass rare earth mine. The fracking boom may provide a useful parallel here too: energy independence has come hand in hand with increased domestic environmental and health costs, as well as political conflict over land rights. In a race to achieve critical metal independence, we are likely to see the tandem production of harms, disproportionately distributed to marginalized communities both domestically and internationally.

    Under the Sea, Beyond the Stars

    Supply security issues and social and environmental harms have inspired a spate of private industry interest in sites far removed from the immediate human impacts of terrestrial mining: the deep sea and outer space. Both deep sea and outer space mining companies frame their missions in terms of social necessity: a green future, they say, cannot exist without them.

    Of the two, the deep sea is more technically feasible in the short term. The International Seabed Authority (ISA), contra its United Nations mandate to protect the sea as the “common heritage of mankind”, has already been granting exploration and mining leases for the seabed in international waters. The promise of deep sea mining appears tremendous: one square kilometer of Pacific deep sea mud is estimated to contain enough rare earths to satisfy one-fifth of the world’s annual demand. For island nations this could introduce a lucrative new revenue stream; for Japan, the prospect of reduced reliance on China for metals is especially appealing.

    The resource security appeal of deep sea mining is accompanied by a set of purported environmental and social benefits. There is, for example, less radioactivity involved with deep sea rare earth deposits. And no one lives in the deep sea, so presumably there are no people to displace or to suffer as collateral damage in the process.

    Of course, while no one lives in the sea, many peoples’ lives depend on it. Reports looking at the potential harm of deep sea mining invariably conclude that preventing biodiversity loss is an “impossible aim”,5 not to mention downstream effects on the ocean’s role as a source for food, medicine, industrial compounds, and so on. There is also the possibility of disrupting other ecological functions the ocean plays, perhaps most alarmingly as one of the most important carbon sinks on the planet.

    If deep sea mining shows that the near-term offers only the possibility of shifting harms, rather than their reduction, then perhaps, several Silicon Valley billionaires imagine, we should shift those harms off-world entirely. Just as waterways were once thought of as endless repositories for refuse, outer space, already rapidly accumulating space junk, is similarly becoming an imagined dumping ground. In Jeff Bezos’s words:

    We send things up into space, but they are all made on Earth. Eventually it will be much cheaper and simpler to make really complicated things, like microprocessors and everything, in space and then send those highly complex manufactured objects back down to earth, so that we don’t have the big factories and pollution generating industries that make those things now on Earth… And Earth can be zoned residential.

    The claimed environmental benefits would be nice, but what is undoubtedly of more interest to Bezos and other space mining companies is sheer profit. The abundance of metals in asteroids and other celestial bodies is massive. One estimate places the concentration of platinum group metals at up to 100 times that in terrestrial deposits, depending on the composition. Its promise is so great that some worry the rapid influx of previously scarce metals will destabilize markets and cause the global economy to collapse. Preventing this would require holding reserves in orbit and slowly releasing supply into the terrestrial economy. This is not really a radical departure from how supply control works now:

    One attorney working for an anonymous firm explained that keeping resources in processed form in Earth’s orbit would effectively be the same as keeping them locked in a vault on Earth—they could be “kicked” down and retrieved only at the firms’ discretion without breaking any current global trade agreements.6

    This rosy view of abundant space metals also figures prominently in post-scarcity utopias, like Aaron Bastani’s “fully automated luxury communism.”

    There are some obvious advantages to mining in space, the most touted being that the pollution takes place off-world. There are some earthbound impacts, namely around launch and reentry, but even taking these into account, the overall impact is estimated to be substantially less than terrestrial mining. One analysis suggests that terrestrial platinum mining emits over 250 times more carbon emissions than the asteroid mining equivalent,7 though this is dependent on the payload size, the amount of transit between Earth and space, energy sources, and so on. But substantial space mining operations would require a great deal of terrestrial infrastructure that doesn’t exist yet, the construction of which includes all attendant political questions and environmental harms that brought us here in the first place.

    Beyond these concerns are others regarding the logistics of these operations. There are roughly two methods for asteroid mining: intercept the asteroid and mine on-site, which is more challenging and expensive, or capture it and bring it into Earth’s orbit. This latter option, though more feasible than the alternative, introduces a new concern: the possibility of impact. For this reason, limiting captured asteroids to 20m or less in diameter is recommended so that, were something to go wrong, it would disintegrate in our atmosphere before crashing into Earth. These calculations are not entirely comforting: in 2013, the Chelyabinsk meteor damaged over 7,000 buildings and resulted in the injury of at least 15,000 people in a relatively sparsely populated area. It was 20m in diameter.

    Many interested in space mining point to inadequate property rights as a barrier to the industry’s development. The 1967 Outer Space Treaty recognizes space as a commons—no nation or private interest can lay claim over a celestial body. As the recent Executive Order demonstrates, this hasn’t stopped the US. As early as 2015 the SPACE Act attempted to unilaterally impose property rights onto space at the behest of space mining companies. The Trump administration’s recent executive order encouraging space mining puts it rather bluntly: “the United States does not view space as a global commons.”8

    The immediate concerns around land and deep sea mining are their social and environmental harms. While space mining would still involve substantial materials, energy, and labor—and all of their consequent impacts—the bigger question is around its near-term feasibility. The recent set of space mining companies have all folded or been acquired for their ancillary technologies (the most puzzling of which is Planetary Resources’ acquisition by the blockchain company Consensys). Space mining may have a role in future mineral extraction, and maybe there’s a way to do it “right”, but we shouldn’t bet the planet on it.

    Reduce, Reuse

    If these harms largely stem from mining new materials, then a reasonable solution may be to make the most out of the metals already in circulation. We should, as one paper puts it, “minimize the seemingly bizarre situation of spending large amounts of technology, time, energy, and money to acquire scarce metals from the mines, and then throwing them away after a single use.”9

    Metals are infinitely recyclable, and ideally we would be able to re-use all of the metals that are thrown away. Recycling is not “free”—it requires energy and labor—but its emissions, energy and water use, and waste are all substantially lower than mining. Yet there are a number of logistical and physical problems that complicate this otherwise clear advantage. Collection and separation are two major issues. Some waste is amenable to “mass recovery”, such as steel beams in buildings which are basically one metal and can be collected en masse when buildings are dismantled. But the shift in how we use metals now—as electronics components, which have metals in only trace amounts mixed with other metals, plastics, and so on—introduce much more complicated collection and separation challenges. Like plastics, recycling electronics components requires individual compliance to send their electronics to proper recovery facilities. But while there is relatively well-established plastics recycling collection infrastructure (which still sees low participation rates), few equivalents exist for electronics. Instead there is a network of informal and highly toxic e-waste circulation and recovery, most famously in Ghana and China. And while automated sorting is a key feature in many sorting facilities, the highly mixed nature of electronics means that automated solutions result in high levels of material loss. Only human labor is capable of adequately separating materials in electronics; the high cost of human labor makes the whole thing uneconomic.

    Logistics aside, a deeper issue with recycling is that its benefits diminish with expanding demand for metals. Growing demand for metals will always require more mining. Movements like right-to-repair suggest a better approach. Repairing and reusing products has the lowest impacts compared not only to mining but also to recycling. But such practices are limited by both anti-repair policies and product design, such as proprietary screws and thinner device profiles.

    Conclusion

    The threat of climate change is global, yet so far the lion’s share of proposed solutions remain, at no fault of their own, stuck in the parochial realm of domestic political constraints. We will transition to renewable energy—but it may be through means whose consequences fall on the global poor. Our vision for decarbonized future must consider how these harms can be ameliorated.

    Read the full report here.


    1. Moreau, Vincent; Dos Reis, Piero C.; Vuille, François. 2019. “Enough Metals? Resource Constraints to Supply a Fully Renewable Energy System.” Resources 8, no. 1: 29.  ↩
    2. Curtis, M. (2019). The Rivers are Bleeding: British mining in Latin America. R. Cifuentes, Trans.). War on Want. ↩
    3. See the full report for visualizations of these overlaps.  ↩
    4. Kuipers, K. J., van Oers, L. F., Verboon, M., & van der Voet, E. (2018). Assessing environmental implications associated with global copper demand and supply scenarios from 2010 to 2050. Global Environmental Change, 49, 106-115. ↩
    5. Niner, H. J., Ardron, J. A., Escobar, E. G., Gianni, M., Jaeckel, A., Jones, D. O., … & Van Dover, C. L. (2018). Deep-sea mining with no net loss of biodiversity—an impossible aim. Frontiers in Marine Science, 5, 53. ↩
    6. Klinger, J. M. (2018). Rare Earth Frontiers: From Terrestrial Subsoils to Lunar Landscapes. Cornell University Press. ↩
    7. Hein, A. M., Saidani, M., & Tollu, H. (2018). Exploring Potential Environmental Benefits of Asteroid Mining. arXiv preprint arXiv:1810.04749.  ↩
    8. See the EO here and the accompanying fact sheet here. ↩
    9. Reck, B. K., & Graedel, T. E. (2012). Challenges in metal recycling. Science, 337(6095), 690-695. ↩
  8. Crisis and Recovery

    Comments Off on Crisis and Recovery

    Today’s Bureau of Labor Statistics (BLS) report hardly registers the cataclysm in the US job market. The sharp 0.9 percent uptick in unemployment—itself newsworthy—only grasps the very beginnings of the shutdown of the American economy. Since the BLS surveys were conducted in the week of March 12, 10 million people have filed for jobless benefits. Only when the April numbers are released at the beginning of next month will we begin to get a fuller statistical picture of the magnitude of the Covid-19 crash. Based on jobless claims so far, the true unemployment rate is probably already over 10 percent. Given the decade-long, bull run of the stock market, one might imagine that the US economy was in good shape before that crash began, and that the labor market can therefore bounce back from the novel coronavirus’s punch once the public health crisis ends. However, the opposite is true: the fundamentals of the US economy were already incredibly weak. They have been for some time. After a decade of slow economic expansion, the US labor market was barely beginning to recover from the last crisis in 2008. If the past is any guide to the future, it will likely take even longer to recover from this one. We are only starting to get a sense of the true extent of this disaster from the perspective of American workers.

    What we already know is that alongside a public health crisis, a broader economic crisis is unfolding, which affects the working population most of all. The labor force is rapidly dividing into three sections. If initial estimates are correct, around a third of Americans will be working from home. The Fed’s back-of-the-envelope tally sees a third continuing to go to work, despite dangerous conditions and lacking appropriate protections. That would mean that the remaining third are already laid off, or will be in the coming weeks.

    In losing their jobs, American workers are not only losing their livelihoods. For most households, a job remains a lifeline to health insurance, which is especially critical in pandemic conditions. Many people, including the dependents of the newly unemployed, are now losing this lifeline. Last year, the Fed found that 40 percent of Americans would have trouble coming up with $400 in an emergency. Given how broken the US healthcare system is, unanticipated medical bills were already triggering many such emergencies before Covid-19. The present crisis acts as an accelerant on an already fragile situation.

    Due to the speed at which the economy is currently collapsing, some analysts are predicting that the coming recession will rival the Great Depression. That would be a massive problem for even a healthy economy to face. However, it will be especially difficult for our economy to face, given how poorly it has performed in recent years. Despite being the longest upswing on record, the past business cycle was the weakest since the Great Depression. Real GDP grew at an average annual pace of just 1.7 percent between 2008 and 2019, as compared to 2.5 percent between 2001 and 2007, and 3.4 percent between 1991 and 2000. For comparison, the average economic growth rate over the quarter century from 1948 to 1973 was 4.0 percent per year.

    Structural slowdowns in American economic growth track differently depending on one’s class position—that is, the extent to which a given household depends on wages rather than returns on capital for the majority of its income. After the 2007 crash, the Fed took extraordinary measures to rescue the value of financial assets, even simulating a major, post-crisis stock market boom. The same was not true of employment. The labor market fell victim to a long, “jobless recovery,” which was only the latest in a series of jobless recoveries since the mid-1970s. Upticks of unemployment used to look like narrow spikes; now they look more like thick wedges. Weak labor markets gave rise to a divergence between US labor productivity growth and workers’ pay, in turn causing a steep and historic decline in the American labor share of income and a rise in the capital share. The last business cycle merely extended these trends.

    It took seven years, until 2014, for post-recession job levels to reach their pre-crisis peak. This jobless growth resulted not from accelerating automation, but rather from a long-term stagnation in economic growth rates, which has had lasting consequences for American workers. By 2019, the final year of the last business cycle, the unemployment rate had fallen to 3.5 percent, its lowest level since the mid-1960s. The economy should have been overheating, with high rates of inflation, yet nominal wage growth for many workers was only beginning to pick up speed. Economists at the Fed argue that, in today’s economy, the unemployment rate no longer adequately captures true labor-market slack. Prime-age employment-to-population ratios were just recovering to pre-recession levels, as people who had dropped out of the workforce ten years ago continued to trickle back to work. Meanwhile, many workers were looking for employment while working because the jobs they had secured post-recession were inadequate, paying low wages relative to their accumulated experience, skills, and education. Statistics only provide a shallow portrait of the extent of suffering American workers have experienced.

    Underemployment was widespread even among workers with college educations, who are supposed to be insulated from poor labor market conditions. According to the EPI, the bottom 60 percent of college educated workers still had lower wages in 2018 than they had in 2000. Many remained stuck in jobs that did not previously require college degrees even though they had taken on large burdens of student debt, for which the government’s temporary freeze on interest payments has so far provided only limited relief. What was in many respects a nascent recovery for working people in 2018 and 2019 has now been cut off in its infancy.

    Working-class households are likely to be even worse off this time around as compared to 2008, and not only because the unemployment rate is expected to climb much higher. Having lost their healthcare in the midst of a pandemic, many households will be faced with rising medical debts, even as they lose family members to Covid-19. If Trump’s proposed cuts to food stamps had not been blocked—they were originally set to take effect this week, on April 1st—the situation for many households would have been even more dire. The past few weeks have witnessed spectacular reversals on the part of some US firms, which would be comical if not indicative of extreme hardships now faced by American workers. Uber, which spent huge sums of money fighting the efforts of its drivers to be recognized as employees, will now be forced to help those same drivers apply for unemployment relief under the CARES act. Yet, like all other workers, these drivers will have a difficult time accessing unemployment benefits.

    The US was unprepared for a labor market crisis of this magnitude. The OECD reported that, already at the peak of the last crisis, only 38 percent of unemployed workers received benefits in the US (as compared to 51 percent in the UK, 60 percent in France, and 99 percent in Germany). According to the NELP, in the years since 2008 many states dealt with budgetary constraints by making it more difficult for workers to apply for unemployment benefits, increasing eligibility requirements while decreasing payouts. As a symptom of this wider trend, states’ websites are crashing under the pressure of attempted applications.

    Looking forward, what are likely to be the longer-term effects of rising unemployment today? Utilizing tools developed in the aftermath of the Lehman Brothers collapse in 2007, the Fed may very well prove capable of stabilizing the financial architecture of the US—and the world—although it is too soon to tell whether their efforts will be successful. Even so, the fallout for American workers is likely to be enormous. With no engine of growth besides the ‘wealth effect’ induced by rising asset values, the US economy is likely to grow even more slowly than it did during the last business cycle—especially if businesses and households are left paying down large accumulated debts and delayed payments. Under those conditions, the labor market will take even longer to recover this time than it did last time, and last time it took seven years to recover.

    Workers will therefore find themselves subject to another long period of employment and income insecurity, likely resulting in further increases in economic inequality. Many people will fall through the cracks, crushed by payments on student loans, car loans, credit cards, medical debts, and rent and mortgage arrears in the context of a weak economy. A substantial portion of the $2 trillion stimulus package consists of handouts to US corporations with little oversight, which is unlikely to drive the American economy back to health. In recent years, corporations have chosen to hold their cash, distribute it as dividends, or buyback their own stocks to raise stockholders’ returns rather than investing in expansion. Changing this situation would require challenging the stranglehold that private investors exert over the economy—something that politicians and their wealthy backers will continue to resist with all their might.

    2019 was already a year of uprisings around the world. Expect more in 2020.

  9. The First Services Recession

    Comments Off on The First Services Recession

    It is hard to see how the United States can avoid a recession. Unemployment insurance claims have already surged, and this week’s numbers look to be in the millions. All indications point to one of the fastest plunges of GDP in US history. Facing this, we may want to turn to previous American recessions to think about our immediate future. But this recession will be different in at least one major way from those of recent memory: services are hit first. In most recessions, services are basically acyclical—they just don’t move up and down with the booms and busts of the economy. The exception here is the Great Depression (see the first figure below), but there the decline in investment is much more severe, as is the upward swing in the recovery. Services, it seems, just don’t fall that much—even in the Depression.

    However, this decline in the Depression is related to the deflation of the early-1930s. This is a nominal series, in dollar terms. If we control for changes in inflation by dividing the nominal services consumption series by the PCE price deflator, we can see that the real series is even more acyclical, as shown below.

    Real services purchases fall little or not at all during recessions. In the case of the 1981-82 recession, we can see that real services purchases even rose faster than before. What makes services so acyclical? One explanation is that services cannot be stored: to consume services during a recession, you must purchase services during a recession. You can drive your pre-recession car during a recession, but your hair keeps growing throughout the downturn. There are furloughs of auto manufacturing workers during every recession, but barbers have typically not been furloughed—until now. Compare that stability to the annual percent change in private investment: it collapses for basically every recession.

    Services make up a little less than half of the economy now, as we can see in the above figure. The share of services surged in the Depression, as the goods-producing sector imploded, but data doesn’t go back before 1929. Goods production was particularly important in mid-century—this is when the manufacturing share of the economy peaks. In general, services go up as a share of the economy during recessions (indicated by the shaded bars), while other parts of the economy shrink more quickly. As we know, services largely involve human interaction. In a pandemic, unlike in other recessions, that will mean sales in the service sector will collapse because of social distancing. And unlike goods, the output of the services sector cannot be stored, which means layoffs will start very soon as businesses adjust their employment downward. For example, while people’s hair will continue to grow, we may see many bankruptcies among barbershops and hairdressers as people cut their own hair to avoid infection. If people cut their hair at home, there won’t be much of an effect of pent up demand to cause demand to surge once the pandemic recedes. This is similar to what we see when people stay home due to extreme weather events—people don’t eat out at restaurants more in the wake of the storm. When previous recessions ended, customers could go back to the dealership and buy some of the inventories of cars available. Once we get COVID-19 under control, customers may return to their favorite restaurant and find it shuttered; this market signal for companies to ramp up production and rehire will be interrupted. These dynamics are very different from what we’ve seen in basically any recession in modern experience.

    February data show retail employment peaked just below 16 million employees and is down closer to 15.5 million now. The retail sector is already hurting, and the closure of malls is likely to accelerate. Meanwhile, the restaurant industry employs over 12 million workers, and layoffs in this industry will be painful as restaurants are forced to close or reduce staff and people stay inside. In the US, total nonfarm employment is about 150 million workers. In February of this year, the retail and restaurant industries combined made up over 18% of total US nonfarm employees; almost one in five US nonfarm workers works in these two sectors alone. If we take the over 100 million workers in the overall private service sector, they make up over 70% of total nonfarm employment. By contrast, all employees in automobile manufacturing, including parts production, are less than 1 million workers, less than 1% of total employment. A recession that begins with a shock to the services sector, which employs a much larger share of workers, can only accelerate job losses relative to a recession that starts in goods-producing industries. For every million in real spending (based on 2012 dollars), there are about 15 employees in the service sector, versus 4.4 employees per million dollars of spending in the durable goods producing sector, or more than three times as many employees in the service sector. As spending falls in services, the job losses will come in a torrent. Already vertiginous initial claims for unemployment benefits are poised to become record-breaking in the weeks ahead.

    As Americans begin to grapple with looming unemployment, they will likely cut back further, beyond the spending that is no longer occurring due to social distancing. This will spread the downturn to the goods producing sector as people delay purchases of consumer durables and other consumer goods—the usual dynamics in a recession. Even people who might spend will be stuck at home. Firm investment cannot but fall as firms are much more capacity than they need to make sales. As demand for air travel (another service) collapses, it’s hard to see when new airplane purchases will next be made given that coronavirus appears to be here to stay in some form. Boeing has a lot of cash and has many side businesses, but their profitability will be impaired significantly in 2020 in the wake of a wave of order cancellations related to the 737 MAX.

    The coronavirus epidemic has the potential to be one of the biggest economic shocks ever experienced. But the response to a sectoral shock like this one should not initially be to stop GDP from contracting, as social distancing is necessary to control the virus. The bill drafted by the House Democrats, “The Take Responsibility for Workers Act,” strikes a promising balance, with a focus on addressing workers and sectors who will be hit hardest by this immediate health and economic crisis—but it is just a start. We will need a bold policy response, on the magnitude of a wartime crisis, to able to return to normalcy. Without aggressive fiscal response, this, the first services recession, will be very long and painful.

    Sources:


  10. The Economics of Race

    Comments Off on The Economics of Race

    Black America has had less wealth, less income, less education, and poorer health than white America for as long as records have been kept. To account for this disparity, economists have advanced three types of explanations: genetic, cultural, and structural. While the first of these had mostly fallen out of favor among social scientists by the mid-20th century (until a worrying revival in recent decades), the latter two have been adopted by somewhat distinct research communities that frequently collide. According to the theory that emphasizes culture, racial disparities are the result of social capital deficits. This is the view that has been most widely adopted by the mainstream of the economics profession, and I refer to it as the neoclassical economics of race. By contrast, the structural theory argues that racial disparities in socioeconomic outcomes are created and maintained over time by American institutions, which privilege white Americans at the expense of Black Americans. This view is known as stratification economics, and, as I argue here, it offers a more accurate and empirically sound explanation for racial disparities in America than its counterpart. The neoclassical and stratification approaches disagree over the causes of and remedies for racial disparities in socioeconomic outcomes and differ substantially in their understanding of income, education, wealth, and health.

    Income

    Outside of market imperfections, neoclassical economists see variations in income as a result of differences in human capital—the stock of skills, talent, and experience deployed by individuals in the labor market in exchange for a wage. This is the basis from which they reason about income disparities by race: either, the account goes, Black Americans lack the sort of skills that are valued in the labor market, or they are being irrationally discriminated against by employers. Gary Becker’s 1957 book The Economics of Discrimination pioneered this view. In it, Becker posits employers and coworkers discriminate because of an irrational preference against hiring or working alongside Black people. Because racially-biased employers implicitly devalue Black labor, they would only employ a Black worker if they could do so at a discount—reducing the starting wage of Black hires. Similarly, racially biased white workers would expect a wage premium to work alongside Black workers. In theory, this type of preference-based discrimination cannot persist over time, as talented Black workers eventually find non-discriminatory firms to employ their skills, and these nondiscriminatory firms prove more productive than their racially biased counterparts in the long run.

    In a 1973 paper, Kenneth Arrow introduced statistical discrimination—a more contemporary neoclassical take on income and hiring discrimination. The theory of statistical discrimination rationalizes discriminatory behavior at the individual level; in this view, employers have limited information with which to judge the future productivity of all prospective hires, and thus rely on group-level statistics, heuristics, and stereotypes to decide whether to make an offer of employment and what that offer should be. Educational attainment is one signal employers might rely on to make these predictions, but, according to the theory of statistical discrimination, employers tend to believe that Black educational attainment is a noisier signal than white educational attainment, or that Black workers are in general either less productive or less reliably productive than white workers.

    Supposed cultural or social capital deficiencies also play a role in neoclassical explanations of racial disparities in income and employment. Economist Glenn Loury and sociologist William Julius Wilson both suggest that decades of diminished cultural expectations brought on by limited opportunities for social and economic advancement have left Black communities deficient in the skills, cultural habits, and social connections necessary to succeed in the modern labor market. Though no inherent disparities exist between Blacks and whites, Blacks enter the labor market unprepared to compete with white workers and are thus justifiably paid less.

    The primary flaws of neoclassical explanations for racial income disparities are that they are both ahistorical and apolitical; that is, such explanations do not deal with the empirical, historical circumstances which brought about these disparities, and they do not account for the role of direct political decisions (or the lack thereof) in perpetuating said disparities.

    By contrast, stratification economics contends that racial disparities in income and employment persist over time and across the educational distribution because there is an economic benefit to employers and white workers. For employers, racial wage or occupational differentiation among employees reduces their capacity for collective bargaining; so long as white workers maintain a higher wage or occupational rank relative to Black workers, their relative superiority can be enough to suppress more extensive workplace demands.

    Stratification economics also rejects the notion that statistical discrimination based on perceived group-level characteristics or signal reliability is justified behavior on the part of employers, and views supposed human capital and cultural deficiencies among Black Americans as an ex post justification for observed labor market disparities. Stratification economists have looked to audit studies for proof that race-based discrimination is neither the result of human capital deficiencies, nor of an irrational reasoning process which is resolved by the market in the longrun. In studies where resumes of varying quality were sent to employers, differing only in whether the resumes were assigned a white or Black-coded name, white resumes received significantly more callbacks for interviews. In many cases white resumes received more callbacks than Black resumes with significantly more “human capital” (as measured by education), and fewer “cultural deficiencies” (as measured by contact with the criminal justice system). The unjustified belief that Blackness adds so much uncertainty to a signal of candidate quality is racism itself; it serves to preserve privileged occupations for white job candidates.

    The empirical persistence of racial disparities in income and employment repudiates Becker’s theoretical analysis of taste-based discrimination and calls into question the plausibility of Arrow’s statistical discrimination hypothesis—if the source of discrimination was indeed some lack of signal reliability, it is unlikely that firms would simply remain unable to properly judge Black resumes. Unless one adopts an unfalsifiable view of “the long-run,” it is hard to argue the case that racial discrimination is punished by the market over time. It seems more consistent with the evidence at hand that such discrimination is in fact rational for businesses, or at least for businessowners. On this theory, then, there is no need to justify Blacks’ consistently higher unemployment rate and lower wages ex post through an appeal to cultural deficiencies.

    Education

    Racial disparities in educational attainment and achievement are widespread and have only narrowed slowly over the past 40 years in the United States. Neoclassical economists have attempted to explain these gaps through an individualist lens. They argue that individual Black students lack the motivation or talent to excel at schooling because of a cultural undervaluation of education. “Oppositional culture” theory is a set of ideas imported from sociology used to explain Black students’ supposed lack of investment in their education. The theory holds that Black students may purposefully avoid doing well in school so as to not be seen as “acting white.” Another explanation popular in behavioral economics suggests that Black students (and Black people generally) place higher value on the present than the future, leading them to underinvest in activities that take a long time to pay off like education. There is little evidence that Black students value education less than their white counterparts, or that Black people broadly associate education with white identity; in fact, Black people have been found to invest more in education when compared to white people of similar socioeconomic background.

    Stratification economists advance empirical evidence to dispute claims that racial disparities in educational attainment stem from individual or cultural deficiencies amongst Black people. At the macro level, they point to the fact that public school funding is determined by property taxes, and thus reflects the stark trends in racial inequality seen in wealth and homeownership. School districts where the majority of students are non-white receive over $23 billion less in funding than majority white school districts every year in the United States. This translates into larger class sizes and less funding per student—an obvious structural source of disparities in educational outcomes that has nothing to do with deficiencies in the students themselves.

    Unequal treatment of students of color is widespread within schools as well. Tracking—the process by which certain students are given access to higher quality education through advanced coursework and smaller class sizes than others—is a common practice that adversely affects students of color in the United States. Black students are less likely to be recommended for or allowed to take these advanced courses than white students, even with comparable or better test scores. These inequities are strongest for young Black women attempting to take courses in mathematics. Contemporary intra-school segregation is another example of how differences in the structure of education systems can generate racial disparities in educational outcomes without individual or cultural deficiencies on the part of Black students, and how these systems can be designed to preserve positions of privilege for white students.

    The stratification economics approach to racial disparities in education rejects the notion that Black students are somehow predisposed to perform poorly in academic settings, and focuses squarely instead at inequities in the resources provided to students as the root cause of differences in outcomes. The policy prescriptions which follow from this understanding stand in sharp contrast with those of neoclassical economics, which tend to emphasize increasing parental involvement in Black students’ educational outcomes—as if the source of achievement gaps lies somewhere with the student’s lack of preparation coming into the school, rather than a difference in treatment at the school.

    Wealth

    Racial wealth disparities are extreme and persistent in the United States. Across income and education groups, wealth disparities remain both massive and widely misunderstood. While the median Black family only holds about $10 for every $100 of wealth held by the median white family, a 2019 study showed that Americans perceive the racial wealth gap to be about 80 percentage points smaller than it actually is (in real terms, they would perceive Blacks as having about half the wealth of an average white family). The gap between Black and white wealth continues to grow as wealth inequality increases overall. If these trends continue, the median Black household is expected to have $0 of wealth by 2053, while the median white household is expected to own $137,000 in wealth.

    As with income and education, neoclassical explanations for wealth disparities focus on differing characteristics of poor and rich households. For some working from a neoclassical perspective, wealthy households are simply better at investing and maintaining their wealth, and therefore the goal should be to teach poorer households the financial strategies necessary to turn their poverty into prosperity. This individualistic approach encourages household investment in education to close wealth gaps, assuming that more education will lead to the adoption of wealth promoting behavior. The racial implications of this perspective are clear; to close racial wealth gap, Black households need to be taught how to manage their investment and spending so that they can gain the financial literacy that white households seem to have.

    By contrast, stratification economics begins by noting that at America’s founding, and for much of its early history, Black people themselves constituted the wealth of white households and large institutions like banks and universities were designed to facilitate the intergenerational transfer of wealth for white people. Even after the abolition of slavery, Black Americans were consistently excluded from government programs critical to building a white middle class, denied access to bank loans necessary to start businesses and purchase homes, segregated into neighborhoods where homes were undervalued, and had whatever homes and businesses they were able to build destroyed by acts of white terrorism. When combined with the fact that intergenerational wealth transfers are a chief source of wealth concentration in the United States, the argument that racial wealth disparities have little to do with individual financial literacy is strong. The contemporary effects of residential segregation and undervaluation of homes in majority Black neighborhoods, mass incarceration, predatory lending, and the lack of financial return on educational investment for Black students make it near impossible to deny that there are structural causes for racial wealth disparities.

    Given that stratification economists see racial wealth disparities as a result of historical and on-going processes of exclusion and predation rather than the individual failings of the poor, their solutions are focused on redress and fundamentally changing forms of wealth accumulation in the United States. Reparations for slavery, Jim Crow, and mass incarceration in the form of wealth transfers to the descendants of those affected by these policies provide a clear path towards remedying Blacks’ historical exclusion from wealth building opportunities. As Darrick Hamilton and Sandy Darity have proposed, baby bonds are a less direct but also effective way to address long standing racial wealth gaps. In either case, stratification economics advocates for a shift in focus from individuals to the structure of the economy and the different resources available to different communities.

    Health

    Health outcomes are arguably the most important indicator of societal well-being. The length and quality of a person’s life are the bases on which other socioeconomic indicators like income and wealth find their value. The fundamental importance of health makes continuing racial disparities in health outcomes that much more tragic. Racial disparities in mortality and morbidity have existed for as long as the National Vital Statistics Service has been collecting data on deaths in the United States. Black Americans still live shorter, sicker lives than their white counterparts, suffering higher death rates from and earlier onset of most diseases. Though perverse increases in mortality driven by “deaths of despair” among white Americans caused a brief convergence of mortality rates at the beginning of the 21st century, even this trend shows signs of slowing as fentanyl has begun to enter Black communities. Black men remain the group with the lowest life expectancy of any demographic group in the United States, and Black women have among the highest rates of sickness and physical disability as they age.

    In the neoclassical framework, individual health outcomes are determined by individual characteristics: decisions to invest in healthcare and other healthful goods rather than other potential wants and needs. In a neoclassical world, the healthiest individuals are those who choose to make the right decisions with respect to diet and exercise, and abstain from risky behavior. This is either because they are genetically predisposed to better health, or because they place a higher value on the future rather than the present.

    While the neoclassical approach to health disparities may explain differences between individuals, it is less useful in explaining racial health disparities. Against this limited framework, stratification economics prioritizes structural inequities between Black and white communities with respect to healthful resources and health depleting circumstances. Racial disparities in income, education, and wealth all contribute to gaps in access to health care, safe neighborhoods, and even the time to exercise and cook healthy meals. Black communities are also disproportionately exposed to psychosocial stressors like discrimination and financial strain, which have been shown to lead to hypertension, inflammation, and other morbidities under chronic exposure. Studies even show that Black people face disparate treatment when seeking healthcare; in a cruel twist of irony, the reluctance of doctors to legitimate Black pain may have prevented the opioid epidemic from reaching the Black community for so long. These structural factors affect large portions of the Black community and can explain the persistence of racial gaps in health outcomes even across socioeconomic categories.

    Conclusion

    Racial disparities in income, education, wealth, and health are widespread in the United States. They are a defining aspect of our history as a nation, and our inability to confront and address these disparities in a substantive way may be one of our great national failures. A first step to doing so, though, is to properly understand their causes and consequences. In economics there have been various attempts to do just that. One community of scholars, those engaged in the neoclassical economics of race, focus on finding ways to correct the behaviors and dispositions of Black Americans, on the assumption that their historically poor outcomes are the result of having cultivated a culture of poor decision making. Another, the stratification economics community, instead looks at the history of the United States and its institutions, how those institutions have so often been designed at the expense of Blacks, and holds that if changes are to be made they must be made at the structural rather than individual level. To the extent that solving racial disparities is indeed a priority for policymakers and interested scholars, the stratification economics approach deserves greater attention and study. The policy-avoidant approach to addressing racial disparities implied and endorsed by the neoclassical economics of race has contributed to the slow progress in closing these persistent gaps. We can make real progress by creating policies at the structural and institutional levels to directly address racial disparities at their root, rather than continuing on a path of misguided and patronizing attempts to shape individuals and culture.