The United Kingdom is in the midst of a protracted crisis in the supply of petrol. In the face of a plummeting sterling and severe disruptions to essential public services, military tanker drivers have been deployed to transport fuel to the country’s 8,380 petrol stations. The lack of truck drivers also led to containers piling up in the UKs most important port Felixstowe, and large shipping companies reroute part of the cargo to continental Europe. On October 1, German news outlet Der Spiegel reported on a “bizarre“ letter sent by the British government to German residents in the UK, asking them to consider work as a trucker. (German drivers licenses issued until 1999 allow drivers to conduct small trucks until 7.5 tons, even if they‘ve never driven a truck.) A similar letter was sent to one million potential truck drivers within the country.
Reports of the petrol shortage tend to focus on the immediate impacts of Brexit—restrictions in trade, and a shortage of essential drivers due to the country’s harsh new immigration rules. By contrast, the Johnson government has continued to extoll the success of rising wages due to tightening labor markets. By centering Brexit, both narratives overlook the deeper causes of the crisis, and the need for extensive industrial reform to remedy them.
Hauler associations had warned the government about shortages of truck drivers as early as 2014. Due to declining wages and standards of work, more truck drivers retire than enter the sector every year. Before the pandemic, 12,500 EU drivers had left the UK as a consequence of Brexit—a large number, but not sufficiently large to induce the current crisis. Due to the pandemic, the number of people who passed tests for lorry drivers fell by 25,000 in 2020. Additionally, the post-Brexit tax change known as IR35 prevented drivers from setting up limited companies to reduce their tax and national insurance contributions, making it more expensive for drivers to work in the UK. The falling pound and anticipated checks on goods at the UK border compounded this effect. But less discussed and more significant are the 50,000 UK based drivers who left the industry as a result of the pandemic and never came back. The flight of these drivers shines a light on the longstanding labor problems endemic in the UK transport industry.
About half of respondents to a recent survey named pay rates and increased resignations as important reasons for the shortfall of drivers. While in 2010, truck drivers in the UK earned 51 percent more per hour than supermarket cashiers, the difference shrank to 27 percent in 2020. Between 2015 and 2021, the median hourly pay for UK truck drivers increased 10 percent, compared to 16 percent across all UK sectors. A 2016 survey similarly attributed resignations to poor wages, poor driver facilities and poor company treatment.
Most drivers leave in their early thirties, since the job is not compatible with family life. While the working time for UK truckers is officially a maximum of ten hours a day (the previous ceiling of nine hours a day was bumped up due to the driver shortage), drivers are often out of the house for twelve to fifteen hours a day, driving to the next pickup location and home. With such long hours, they have only enough time to sleep after work. Added to this are unpredictable shift patterns and frequent weekend work. The low quality of facilities for drivers in the UK compared to many EU countries—dysfunctional showers, low food quality and high prices at highway restaurants—was another persistent issue. Lack of Covid-19 tests and harsh lockdown controls during the pandemic were the last straw which prompted drivers to leave. The resulting labour shortages increased the pressure on the remaining drivers to work longer hours, exacerbating the cycle.
Ironically, by illuminating the reliance of industrial sectors on cheap migrant labour, Brexit and the pandemic have counteracted some of these trends. Supermarkets like Aldi, Tesco and Asda and cooperative retailer John Lewis have raised wages for truck drivers or begun to pay sign-on bonuses. UK Trade Union GMB negotiated a 20 percent pay rise for drivers with delivery company Yodel after 95 percent of union members had voted for industrial action. But while they may cause some drivers to change employers, these measures do not resolve the underlying problems, and consequently they are unlikely to bring drivers back into the market. Just this year, the wages of UK truck drivers rose 20 percent, but the number of truckers did not increase significantly.
Pay rises in some sectors also fail to increase overall income: avoiding a wage-price spiral requires a commensurate increase in productivity. With no plans for industrial investment, no proposals to alter Britain’s brutal anti-union rules, and rigid anti-protest measures in the works, the country’s declining labor standards have the potential to induce future supply shortages in coming months, particularly with Black Friday and Christmas around the corner. At current rates, it will take two years to fill the gap in necessary truckers. In order for new drivers to remain in the sector, the conditions of their work will have to change.
2021 marked the centenary of the creation of the Chinese Communist Party, born of the May Fourth Movement of 1919. History textbooks tend to claim that the Movement emerged out of a widespread realization that China’s rights as a victorious power during WWI had been sold out at the Paris Peace Conference by the European Powers. Students were angered by elite collusion with Japan and the corruption of the early Chinese Republic—also known as the “Beiyang Regime.” The activists found hope in the new Soviet model, and May Fourth is credited with bringing Bolshevism to China and beginning its socialist phase.
In Japan, conversely, state-led economic development has often been attributed to a deliberate attempt to mimic the West industrially and militarily since the Meiji era. Japanese developmentalism is perceived, in contrast to the dramatic revolutionary politics in China, to be strategic and straightforward, enabled by the post-WWII foundation of free market capitalism.
In fact, the state-driven economic development models found in both countries are the products of a long and intertwined ideological history. In the late nineteenth century, Chinese and Japanese economists drew inspiration from Hamiltonianism (also known as the “American School”) and German State Socialism to pursue social reformist aims while managing rebellions from below. Developmentalist ideas formulated in this era formed the foundation for later revolutionary programs and postwar capitalist states across the region. Accurately historicizing these models is crucial to understanding their role in contemporary East Asian politics.
Friedrich List, the American School, and the birth of German State Socialism
Modern era developmentalism, which seeks to promote growth using the fiscal and administrative power of the state, originated in the Federalist economic policies of Alexander Hamilton. Inspired by Louis XIV’s Mercantilism, and penned by Hamilton’s secretary Tench Coxe, the policies advocated in Hamilton’s Report on Manufactures and two reports on public credit included import-substitution industrialization, funded by a national bank and high protectionist tariffs, in order to secure the economic independence of the nascent United States. These ideas formed the basis of the “American School” of economics.
Developmentalist ideas soon reached France through Henri de Saint-Simon, a French aristocrat who had fought in the American War of Independence and whose readers later included the Marquis de Lafayette, a member of Hamilton’s circle. (Saint-Simon and Hamilton had both taken part in the successful 1781 Siege of Yorktown.) After the Napoleonic Wars, Saint-Simon developed his vision of a society led by the productive industrial classes. In plans presented by Saint-Simon to the Viceroy of Mexico, and by his disciple Prosper Enfantin to Governor of Egypt Muhammad Ali, a global vision was developed—of huge infrastructural projects like the Panama and Suez Canals linking the countries of the world with a federalized Europe.
Saint-Simon’s death would motivate two interpretations of this vision. On the right, figures like the Pereire brothers pioneered industrial investment banking for large projects like railways. On the left, economist Constantin Pecqueur developed the first coherent vision of a State Socialist planned economy—where France was envisaged as an enormous, democratically organized workshop in which property would be nationalized, and each province assigned production targets based on consumption trends. Although its direct effect on the region is scant, this latter interpretation of Saint-Simonianism contained the primary ingredients of East Asian developmentalism. But these ideas would only arrive in the region via Germany.
Saint-Simon was not the only development theorist who was influenced by events in the United States. Towards the 1830s, the British began dumping goods in German markets, destroying Germany’s handicrafts industries. Surveying the situation was economist Friedrich List, who had lived in the US, been a protege of Lafayette’s and an associate of the Saint-Simonians, and who attributed the weak economic resistance of the German middle classes to their misguided faith in Adam Smith. The correct approach, he argued, was to mimic the “American System” by establishing a German Customs Union and developing domestic economic productivity. He also argued for the expansion of this union into what was later known as Mitteleuropa, to encompass central European states, eventually extending to the Middle East. List’s influence was extensive in both Germany and the US, forming the German Historical School and maintaining a guiding foundation on the American School. The former later gave rise to the Social Policy Association, a group of moderate academic social reformers.
Key among the followers of both Listianism and the American School was Otto von Bismarck. In the wake of the economic crisis of the 1870s, the growing workers’ movement across Europe challenged the stability of the conservative German state. Drawing on the theories of Friedrich List and the US economist Henry Charles Carey, as well the advice of social democratic leader Ferdinand Lassalle and Social Policy Association leaders such as Gustav von Schmoller, Bismarck raised tariffs, nationalized Prussia’s railways, and introduced workers’ insurance and pension schemes. Under Bismarck, the state had subsumed the ideas of socialism to its own advantage.
Bismarck was the first statesman to pursue such policies in a major country, and to also openly admit to their “socialistic” character. In a speech at the Reichstag in 1882, he declared “If you believe that you can frighten anyone or call up spectres with the word “Socialism,” you take a standpoint which I abandoned long ago, and the abandonment of which is absolutely necessary for our entire imperial legislation.”1(<)meta charset='utf-8'(>)William Harbutt Dawson, (<)em(>)Bismarck and State Socialism(<)/em(>). London : Swan Sonnenschein & Co., 1891. 63-64. Bismarck was initially mocked by the social democrats whom he repressed: “State Socialism” was thus originally a derogatory term used to describe his approach. But when his policies began to prove successful, the term was proudly embraced by Bismarck’s followers, and it went global.
Economic statism in Japan
Listianism and the American School had reached Japan even before Bismarck’s reforms. In an 1874 memorandum, Meiji Restoration leader Ōkubo Toshimichi [大久保利通] argued that the state had a responsibility to “encourage and reward” industrial development; only once a strong industrial base had been formed would Japan possess the preconditions for free trade.2(<)meta charset='utf-8'(>)Okubo Toshimichi, “Shokusan Kōgyō ni kansuru Kengisho” [殖產興業に關する建議書] summarized in Byron K. Marshall, (<)em(>)Capitalism and Nationalism in Prewar Japan – The Ideology of the Business Elite(<)/em(>). Stanford : Stanford University Press, 1967. 16-17; Iwata, Masakazu. (<)em(>)Okubo Toshimichi – The Bismarck of Japan(<)/em(>). Berkeley and Los Angeles : University of California Press, 1964. 236-238. This perspective, and the dirigiste decade that followed, was actively shaped by economists who followed Hamiltonian and Listian policies from the United States—the 1872 ten-year plan for Hokkaido, for example, was developed by ex-Commissioner of the US Department of Agriculture Horace Capron, who had been active in the Hamiltonian Whig Party circles. In 1881, finance bureaucrat Wakayama Norikazu [若山儀一] drew on List’s main work, National System of Political Economy, in his Memorandum on Protectionist Tariffs [保護稅說].3(<)meta charset='utf-8'(>)MITI, [通商產業省] ed. Shōkō Seisaku Shi (History of Commercial and Industrial Policy), vol. 5 [商工政策史:卷五] Tōkyō : Shōkō Seisaku Shi Kankōkai [商工政策史刊行會] 1965. 203-204.
List’s book itself was however not translated into Japanese until 1889, by educator and government translator Ōshima Sadamasu [大島貞益], working with ex-President of Bank of Japan Tomita Tetsunosuke [富田鐵之助]. The debt and inflation that the Japanese government had accumulated at the end of the 1870s gave way to a decade of austerity and deflation. Anticipating the third world deflationary policies of the 1980s, Japan’s new Finance Minister and later Prime Minister Matsukata Masayoshi [松方正義] privatized many state-controlled industries, selling them off to leading conglomerates such as Mitsui. Matsukata systematically ostracized Listians from government—he purged the US policy-influenced Tomita Tetsunosuke, who had advocated the creation of a government industrial investment bank. Matsukata also undermined Maeda Masana [前田正名], a young French-educated bureaucrat in the Japanese Ministry of Agriculture and Commerce who sought state promotion of agricultural development.
There was no alternative for the statists but to fight back. Tomita, Ōshima and finance bureaucrat Kōmuchi Tomotsune [神鞭知常] established in 1890 the National Association for Economics (NAE 國家經濟會) to champion Listianism and Bismarckian State Socialism. Their strategy worked, and would have a profound impact on Japan. In 1897, following the German example, Japanese academics set up the Association for Social Policy Studies. By 1906–7, Prime Minister Katsura Tarō [桂太郎—as head of a political party that had adopted many of the NAE’s policies and some of its members—nationalized Japan’s railways on Bismarck’s example. The Japanese state monopolized the post, telegraph, water, gas and steel industries, and began subsidizing shipping and banking. It managed to restore control over customs tariff rates after 1911, during treaty revisions following its war against Russia in 1904–5. At the time, Japan was referred to by the domestic press such as The Japan Times and western journalists such as Hamilton Holt, editor of The Independent in New York, as the most successful State Socialist country outside Europe, if not worldwide.4(<)meta charset='utf-8'(>)“Japan Today,” (<)em(>)The Japan Times(<)/em(>), May 26, 1912.
But Holt was careful to state that “Japan has gone into these ‘socialistic’ measures, however, not from any conversion to the tenets of Socialism, but because she has wanted to make money.” It was precisely because of this that State Socialism in East Asia was primarily concerned with state ownership of industries and direction of growth. The welfare aspects of Bismarck’s model had been deemed irrelevant to East Asian development by members of the elite establishment. But with economic growth came labour and agrarian struggles. By ignoring social reformism, early twentieth-century East Asian political leaders were sowing the seeds of the revolutions that would shake the region to its core.
State Socialism goes to China
In 1898, following the failed Hundred Days’ Reform in Peking, Liang Qichao [梁啟超], a leading thinker during China’s turn-of-the-century “enlightenment” and a constitutional monarchist, fled to Japan. There, Liang grew acquainted with western statist theories through Japanese literature, notably written by NAE member Shiba Shirō [柴四朗], who had studied business and finance in the US. Shiba’s novel had a title that masqueraded the intensely political nature of its contents—Strange Encounters with Beautiful Women.5Donghai Sanshi (Tokai Sanji), [東海散士] (<)em(>)Jiaren zhi Qiyu. (Strange Encounters with Beautiful Women)(<)/em(>) [佳人之奇遇] Shanghai : Zhongguo Shuju, [中國書局] 1935.29.In it, Shiba tells through the voice of Colleen, an “Irish beauty”, that not only has Ireland been annexed by Britain, but that the Ottoman empire and India “are independent in name only and not in fact. Their trade is in imbalance year after year and bullion flows out of their borders. Although they are not tributary states of Britain, their situation is no different from offering as tribute to Britain the lipids [read: riches] that have been squeezed out of their own citizenry.”
After a tour of the US in 1903, Liang wrote in a travelogue that he had been converted to State Socialism, “an ideology that becomes sounder by the day”, which “uses an extremely autocratic method of organization to put into practice a spirit of extreme equality, which miraculously matches the nature of Chinese history.”6(<)meta charset='utf-8'(>)Liang Qichao, Ouyou Xinyinglu ; Xindalu Youji. (<)em(>)(Reflections on My Travels in Europe ; An Account of My Travels in the New World) [歐遊心影錄;新大陸遊記](<)/em(>) Beijing : Dongfang Chubanshe, [東方出版社] 2012. 266. Liang saw the nationalization of railways, mines, and factories as the policies of a future China. Elsewhere, he advocated the cartelization of industries on the American model, believing it to be a necessary reaction to nineteenth century laissez-faire. And, presaging the “State Monopoly Capitalism” of the postwar period, Liang argued that such cartels would have to come under government control. A “State Capitalist Trust” thus formed would secure government command of the economy through the private sector.
Friedrich List’s developmentalism had also begun to find an audience among Chinese students. Sections of List’s work were published in Chinese as early as 1901 in a student journal in Tokyo whose editors included Cao Rulin [曹汝霖] and Zhang Zongxiang [章宗祥]–two Beiyang bureaucrats who would later be labelled pro-Japan collaborators by the May Fourth Movement. In 1908, the Japanese-educated student leader Yang Du [楊度] was invited to lecture Manchu nobles at the Summer Palace in Beijing on the topic of Japanese “economic militarism.” To his audience’s embarrassment, he argued for a constitutional monarchy, but not only that—he also proposed that the Empire be reformed into an enlightened industrializing regime prioritizing production if it was to avoid a socialist uprising. Since 1908, generations of Chinese politicians and activists have pursued variations of this regime. Indeed, by the 1930s, Yang Du had been converted to revolutionary socialism and became a member of the CCP.
In 1906–7 the Chinese Revolutionaries and Constitutional Monarchists held a protracted discussion on State Socialism. Despite their differences, both sides agreed on key State Socialist principles. Among the revolutionary theorists, Feng Ziyou [馮自由] argued that a post-revolutionary military government should implement German and Japanese-styled State Socialism alongside land reforms. While the gentry-led Constitutional Monarchists opposed land reform, they agreed that industrial nationalization could be implemented under a constitutional empire under the auspices of “Social Reformism.” In 1908, Sheng Xuanhuai, [盛宣懷] head of China’s largest steelworks at Hanyang and soon to be Minister of Communications, visited Japan and had a long conversation with Prime Minister Katsura Tarō. Under Katsura’s influence he sought to implement a railway nationalization policy in 1911, which involved the forcible purchase of the shares of local railway companies, in which many members of the budding gentry-bourgeoisie had invested. The proposal ignited the widespread protests that culminated in a Republican revolution.
But after the revolution, Sun Yat-sen, the Provisional President of the Chinese Republic, surprised the public by announcing that he would not reverse railway nationalization. He championed State Socialism against revolutionary socialism, arguing that limiting the growth of private capital would prevent class conflict at the foundations. Indeed, he announced that State Socialism was equivalent to the “Doctrine of Popular Livelihood,” one of the founding principles of the Chinese Republic alongside Nationalism and Democracy. China, he argued, should learn from Germany in this regard. It should embark on a vast railway construction program with a target of 100,000 kilometers; he expected optimistically that the railways’ revenue would adequately fund all public expenditure.
Following Sun’s resignation, the new Republic came under the guidance of a group of ex-Imperial bureaucrats who had visited or studied in Japan. They were known as “Beiyang bureaucrats,” after the North Sea military establishment which modernized much of Northern China under Viceroy Yuan Shikai [袁世凱]. Yuan Shikai succeeded Sun Yat-sen as President of the Republic. His Finance Minister Zhou Xuexi [周學熙] had been the “industrial tsar” of Tianjin (Tientsin), where the empire’s light industries had been concentrated, and upon assuming office announced the enactment of State Socialism and the development of a dozen key industrial sectors. Minister of Agriculture and Commerce Zhang Jian [張謇] was credited with building Nantong [南通] as China’s first company town, with successful textile production predicated on adequate provisions for workers. Zhang, too, approved of State Socialism, and his “Cotton and Iron Doctrine” [棉鐵主義] promoted import-substitution and export orientation through cotton, iron, and wool production.
The Corrective Revolution and the Beiyang Leap Forward
Though the Beiyang Regime—the early Chinese Republic—has often been characterized as a “warlord regime,” throughout its existence it tried, ultimately unsuccessfully, to cling onto the appearance of a constitutional representative government. In summer 1917 the fractious Chinese Parliament was dissolved, and Puyi’s monarchy briefly restored before it was repressed by German-trained General Duan Qirui’s [段祺瑞] republican troops. Duan initially formed a cabinet with Liang Qichao and his Progressive Party. These men conceived of their coup d’état as something akin to what mid-twentieth-century Arab leaders would come to call a “Corrective Revolution,” in which traditionalist reaction, political pluralism and radicalism, and economic liberalism would be swiftly replaced by a centrist monolithic developmental regime that granted traditional elites a place in the new socioeconomic order.
Duan and Liang fell out in late-1917, and Duan governed until August 1920 through the “Anfu Club” [安福俱樂部], a coalition of bureaucratic and parliamentary factions most of whose leaders were educated abroad. Electoral laws were rewritten to vastly increase the property requirements for voting and for candidacy. A bill was proposed which would have turned the Chinese Senate into a corporatist chamber complete with economic representatives. The gentry-literati empowered by these reforms were expected by Liang to develop into an industrial class that would form the future bedrock of the Republic. Duan’s industrial policy, formulated with help from Liang Qichao, was shaped by the war-induced global commodity boom and the economic successes of Japan. Through “Economic Investigation Committees” [經濟調查會] at both national and local levels, and by empowering technocrats in the Ministry of Agriculture and Commerce previously hired by Zhang Jian, Duan and Liang tried to assemble reliable statistics using large scale geological, industrial, and agricultural surveys.
The economic plans of Duan’s Regime culminated in the rollout of “Nishihara Loans,” named after Nishihara Kamezō [西原龜三], secretary to the Japanese Prime Minister Terauchi Masatake [寺內正毅]. As a student of Kōmuchi Tomotsune, Nishihara was steeped in the NAE’s Listian tradition. Both the Prime Minister and his secretary opposed reckless military intervention in China, believing that it would only invite rivalry with the European powers in East Asia. In January 1918 Nishihara began to use economic intelligence available to the Prime Minister to compile a State Socialist reform manifesto, Strategy for Economic State-Building [經濟立國策]. In it, Nishihara argued that China’s rise was not to be feared; that its prosperity would form the basis of Japan’s future development, and consequently that Japan should treat China as a credible partner and assist its economic growth.
Nishihara’s approach was a tremendous change to the bullying tactics of Terauchi’s predecessor, Prime Minister Ōkuma Shigenobu, who notoriously raised 21 demands against China after sending an army to occupy the German colony of Qingdao (Tsingtao). These demands would have reduced China to the status of a protectorate. Duan and Liang, delighted to see this change of attitude on the part of the Japanese, and desperate to participate in WWI in order to gain a place in the postwar peace conference and reclaim the right to raise the customs tariff rate, welcomed Nishihara’s loan package with open arms. Cao Rulin (a member of Anfu’s Club Council, its de facto Central Committee) and Zhang Zongxiang, the Beiyang bureaucrats who had published List’s writings in their student journal, became responsible for negotiating and handling the Japanese loans.
Nishihara’s vision revolved around the formation of an “East Asian Economic League” [東亞經濟同盟], which included Marshall Plan-style Japanese investment in China, and the pegging of China’s currency to the gold-coupled Japanese yen. Nishihara also advocated the return of foreign railway concessions and the Boxer Indemnity, which would be used to fund industrial expansion and occupational education. The Chinese cabinet was to set up an “Industrialization Board” to coordinate the use of these funds.
Building on Zhang Jian’s “Cotton and Iron Doctrine,” Nishihara based his plans on those of the European-trained Chinese technocrats Ding Wenjiang [丁文江] and Weng Wenhao [翁文灝] in the formulation of a “Great Leap Forward.” The plans were sweeping. In Pukou, on the opposite bank of the Yangtze to Nanking, a “National First Steelworks of the Republic of China” [中華民國國立第一製鐵廠] would be built and steel production would rise from 30,000 to 112,500 tons by 1921. Cotton production would rise to 907,500 tons by introducing American crops. Wool would be extensively produced in the northwest by importing new breeds of sheep. A vast new “Central Asian Transversal Railway” [中央亞細亞橫斷鐵道], based on Chinese plans, would link Qingdao on China’s eastern seaboard with the Mediterranean.7(<)meta charset='utf-8'(>)Archival Documents at the Modern History Institute, Chinese Academy of Social Sciences: Mianye Jihuashu. [棉業計畫書] CASS-MHI, Jia-350.160; Nongshangbu Mian Mao Tie Deng Jian [農商部棉毛鐵等件], CASS-MHI, Jia-250.163; Zhongguo Tieye Jihuashu, [中國鐵業計畫書] CASS-MHI, Yi-G54; Nishihara, Kamezō. [西原亀三] Keizai Rikkoku Saku (Strategy of Economic State-Building). [經濟立國策] Tōkyō: Yuhikaku. [有斐閣] 1918; Yamamoto, Shirō, [山本四郎] ed. Terauchi Masatake Naikaku Kankei Shiryō. [寺内正毅内閣関係史料] 2 vols. Kyoto: Kyōto Women’s University, [京都女子大學] 1985. This was to be an economically-based, globalizing Pan-Asianism with a farsightedness rarely matched until after WWII.
The Japanese Army, which operated semi-independently of the government, resented Nishihara’s rapprochement. When he lent some 145 million yen to China’s Beiyang Regime through Japan’s state-owned banks (the bulk of Japan’s earnings from the wartime trade boom), officers like Vice Chief of Staff Tanaka Gi’ichi [田中義一] felt that Japan had placed all of its eggs in one basket. Tanaka’s men had long been funding insurgents against Yuan Shikai and later Duan Qirui. Sun Yat-sen set up his base in Guangzhou and launched a war to reconquer the north, accepting vast sums of money from Germany. Civilian and military factions of the Japanese government thus attempted to turn the Chinese civil war into a proxy war amongst themselves. Duan had no choice but to squander Nishihara’s funds on a protracted war with the south, although a substantial portion also went to repay foreign debt.
Incidentally, the Central Asian Transversal Railway proposals led to a major crisis for Sino-Japanese relations and the Anfu Regime. The “Shandong Question,” concerning the right to build and manage the first section of the line, exploded at the Paris Peace Conference. This led to the May Fourth Movement in 1919. The Beiyang bureaucrats—who were more concerned with keeping industrial plans secret from China’s wartime enemies than with their propaganda value within China, or with the potential backlash of opinions against receiving Japanese loans—became targets of early rebellion. Cao Rulin’s mansion was burnt down and Zhang Zongxiang severely injured when he was beaten up by an angry mob of students. Nishihara’s “East Asian Economic League” collapsed, becoming a lost opportunity for the two countries to cooperate constructively; the inability for China to return any of the loans would in future prevent Japanese politicians sympathetic to China from making financial overtures to China, which left only military solutions to continental problems. From the late-1920s onwards, opponents of the Nishihara Loans such as the military strongman Tanaka Gi’ichi would come to have the upper hand in deciding China Policy, and this led directly to the military expansionism of the 1930s onwards. Nishihara remained adamantly opposed to the Japanese invasion of China in the 1930s-40s, writing in his autobiography that he regretted his inability to prevent Japan’s slide into war and fascism.8(<)meta charset='utf-8'(>)Nishihara, Kamezō. [西原亀三] (<)em(>)Keizai Rikkoku Saku (Strategy of Economic State-Building)(<)/em(>). [經濟立國策] Tōkyō: Yuhikaku. [有斐閣] 1918.
This was not the end of the Beiyang Regime’s engagement with State Socialism. On July 8th, two months after the student protests, the Anfu Club held a meeting for its parliamentarians. Its chief whip Wang Yitang insisted that socialism had become a dominant political force after the Great War, and that as the governing party, the Club was responsible for the nation’s livelihood. The Club’s party newspaper published reports on social reforms in Japan including workers’ housing in Osaka, and advanced gradual social policy against communism and anarchism. That month, the cabinet’s Postwar Economic Investigation Commission (PEIC) [戰後經濟調查會] passed a “Labour Protection Ordinance” [保護勞工條例]9(<)meta charset='utf-8'(>)“Baohu Laogong Fa’an” (Labour Protection Act) [保護勞工法案], in Gongyan Bao (Fair Comment) [公言報] 1919-07-21/22.(<)br(>)10“Nongshangbu Zhuzhong Quanguo Minsheng zhi Buzi” (Ministerial Proclamation by the Ministry of Agriculture and Commerce on Emphasising National Popular Livelihood) [農商部注重全國民生之部諮], in Gongyan Bao (Fair Comment) [公言報] 1920-03-12. which made Sundays a holiday, ordered factory owners to set up night schools, banned unsanitary and unsafe factories from hiring workers, and made workers’ insurance and pensions compulsory. This overlooked ordinance could be seen as the first Chinese official statement on labour rights. That same year, in response to the Bolshevik threat, Duan also sent his ablest lieutenant, Xu Shuzheng [徐樹錚], to lead a Japanese-trained expeditionary army into Outer Mongolia where he proposed a Saint-Simonian package of railways, mines, and animal husbandry.
In 1920, the PEIC reformed itself into the Economic Investigation Bureau [經濟調查局]. Massive industrialization, hydro-electrification and motorways were planned for the Peking region. The state began to openly advocate the cooperativization of the peasantry, handicraft artisans, and industrial laborers. President Xu Shichang, [徐世昌] also an ex-imperial bureaucrat, announced his wish to prevent “social class warfare.”[^classWarfare] Under this plan, “Peasant-Worker Banks” were established across the country to provide credit to farmers, allowing them to avoid usurers. In addition, a cartel of national and semi-national banks was also proposed, so as to reduce China’s dependence on foreign finance. This second wave of industrial proposals in 1920 was a substantial improvement on the first one from 1917, in its focus on domestic investment and preventative measures. All of this was to be aborted by the July 1920 civil war which toppled the Club Regime. The next year, in summer 1921, the Chinese Communist Party was formed, and the country would now follow a very different trajectory towards socialism.
State Socialism and Modern East Asia
During WWI, Walther Rathenau, head of the Raw Materials Section of the German War Ministry and son of the founder of AEG, created the first planned economy in modern history. Rathenau used punch card computers made by the German subsidiary of IBM to coordinate large amounts of data. He installed “War Corporations” that coordinated state demands with each sector. And he instituted a system of collective bargaining and argued for the breaking up of landed estates for collectivized agriculture. He also resurrected the proposals for a Mitteleuropa. Conceived and instituted during wartime, these efforts were key to his vision of a collectivist society.
Nishihara Kamezō [西原龜三]
The Japanese military translated Rathenau’s lectures and, along with other intelligence, they reached Nishihara. Having consulted the opinions of the professors who led the Association for Social Policy Studies, he began to write a manifesto for social reform. In his 1918 Strategy for Economic State-Building,11(<)meta charset='utf-8'(>)Nishihara Kamezō, Yume no Nanajyu yonen – Nishihara Kamezō Jiden (A Seventy-something year Dream – The Autobiography of Nishihara Kamezō) [夢の七十余年 - 西原亀三自伝] Kitamura Hironao, [北村敬直] ed. Tōkyō : Heibonsha, [平凡社] 1965, 278. he called for the establishment of a Controlled (i.e. Planned) Economy in Japan, as a precondition to setting up the “East Asian Economic League,” and to increase Japan’s per capita national income from 60 yen to 200. A single “Imperial Commodities Corporation” [帝國商品株式會社] would replace the whole retail sector with city-centre department stores, and this corporation would be linked to a collectivized agricultural and handicrafts sector. Land reform would distribute two hectares to each peasant family, and these would later be collectivized. Local administration would be run cooperatively, hydro-electric power stations and grids would be constructed throughout the country, and worker housing would be constructed in industrial zones using increased corporate taxes. China’s rapid industrial development, made possible by Japanese finance, was meant to be complementary to Japan’s own State Socialist transformation—it would have ushered in a new State Socialist era for all of East Asia. (To a certain degree, it was the failure to implement these reforms that cost Prime Minister Terauchi his power, when “rice riots” erupted across the country in summer 1918 due to inflation.)
But an economic and social system based on Rathenau’s model would emerge first not in Japan, but in the Soviet Union. Amongst the admirers of List and Bismarck was Sergei Witte, the Tsarist Finance and Prime Minister credited for having laid the foundations of Russia’s heavy industries and later, Soviet economic power. Vladimir Lenin followed German developments closely and thought that Rathenau’s system of “State Monopoly Capitalism,” combined with proletarian soviet power, would provide all the necessary conditions for a transition to socialism.12(<)meta charset='utf-8'(>)Roman Szporluk, (<)em(>)Communism & Nationalism(<)/em(>). New York : Oxford University Press, 1988; Lenin, “Can We Go Forward if We Fear to Advance Towards Socialism?”, in “The Impending Catastrophe and How to Combat It”. In (<)em(>)Lenin’s Collected Works(<)/em(>), vol. 25. Moscow : Progress Publishers, 1977. The Rathenau model and Witte’s industrial legacy thus became the basis of “War Communism” and later, Stalinist industrialization.
Nishihara continued to advocate a Controlled Economy into the 1920s. With the onset of the Great Depression, the Stalinist model gained appeal, and Nishihara’s associates argued for a Five Year Plan which was nearly implemented in 1932 by Prime Minister Inukai Tsuyoshi [犬養毅], who himself had translated the works of Henry Charles Carey. Inukai was soon murdered by army officers for refusing to recognize the Japanese occupation of Manchuria (otherwise known as Manchukuo, the puppet state they had created). It was in Manchukuo however that Japan’s Soviet-inspired “reform bureaucrats” and many left-wing intellectuals fleeing from domestic repression found their chance to experiment with economic planning. Satō Daishirō [佐藤大四郎], an ex-member of the Japanese Communist Youth League, spearheaded a campaign to collectivize the Manchurian peasantry, until he too was arrested and killed for his activism. From 1936 onwards the leader of the reform bureaucrats (and a future Japanese Prime Minister), Kishi Nobusuke [岸信介], oversaw the implementation of two Five Year Plans aimed at rapid heavy industrialization, which ironically built up the necessary industrial might for the Chinese Communists to conquer the country in the late-1940s and to end in a draw with the US-led troops in Korea in 1953.
During the 1930s Japan’s economy was gradually placed under government control and subject to Keynesian investment under the auspices of Maeda Masana’s erstwhile protege, the Finance Minister Takahashi Korekiyo, [高橋是清] who continued Inukai’s plan without calling it as such. In 1940 a “New Economic System” was proclaimed. Under a war economy, the government attempted to assume managerial powers of privately-owned firms. After 1945, many Japanese technocrats returned from Manchuria to head post-war Japan’s Liberal Democratic Party and the leading economic departments, including the Ministry of International Trade and Industry (MITI) and the Economic Planning Agency. The result was a highly-planned capitalist economy, which would come to influence both South Korea and China. Through a practice known as “amakudari,” retired MITI bureaucrats were even inserted into the board of directors of leading enterprises, thus ensuring government direction over private businesses. This came alongside labor strikes and student protests which grew into the 1970s, reflecting the pressure of ordinary life under State Monopoly Capitalism.
Manchurian experiences also influenced both Koreas. North Korea developed the heavy industrial and hydro-electricity-based policies and the network of rural cooperatives established by the colonial government. These cooperatives had been established by Governor Ugaki Kazushige in 1932 on the advice of Nishihara and others, and had been a source of inspiration for Satō’s experimental collectives in Manchukuo. Japanese technicians who remained in North Korea after 1945 were amazed by the effect that Communist ideology had on the Korean workers’ performance compared to high-pressure colonial policies that had previously forced laborers to toil under brutal conditions. Some of the Japanese were even awarded “labor hero” medals.
Under ex-Manchukuo bureaucrat Chong Hyon-chun [鄭顯準] and a group of US advisors, South Korea drew up a Five Year Plan for 1949-53 but the plan was aborted due to the Korean War in 1950. Syngman Rhee later unsuccessfully proposed a Seven Year Plan. Park Chung-hee, [朴正熙] who seized power in a 1961 military coup and became head of the junta, was a former Manchukuo officer. Under his aegis, the effectively single-party South Korean state began to implement the first of seven Five Year Plans, fueling a “forced-paced industrialization” of the nation aimed at realizing what Park called “Miracle on the Han River” and turning the country into one of the Four Asian Tigers. It has also been argued that the “New Village” or “Saemaeul” Movement of the 1970s, where Park Chung-hee invested in the reconstruction of a semi-collectivized rural economy, was in fact a continuation of the cooperative policy of the 1930s. Park was assassinated in 1979 amidst a wave of nationwide student and worker protests.
Nishihara died in 1954. His influence permeated the post-war period through Ikeda Hayato [池田勇人], head of MITI and the Finance Ministry in the late 50s and Prime Minister by 1960. Under Ikeda, who wrote the calligraphy on Nishihara’s grave, Japan signed trade agreements with China and North Korea, and implemented a “National Income Doubling Plan”, realizing Nishihara’s “growthist” goals from 1918. Tsushima Juichi [津島壽一], in 1918 a young Finance Ministry bureaucrat who helped Nishihara write his State Socialist manifesto, survived to be President until 1962 of the Japanese Olympics Committee, which oversaw the 1964 Tokyo Games. His protégé was Ōhira Masayoshi, [大平正芳] who became Prime Minister in 1978-80 under the help of Liberal Democratic Party faction leader Maeo Shigesaburo [前尾繁三郎]. Maeo had hailed from Nishihara’s Kyoto region and had been under his immense influence during his youth, reading the original translation of List as done in 1889 by Oshima and Tomita, as well as other books on State Socialism. Maeo and Ōhira formulated a policy to provide developmental aid funding Deng Xiaoping’s open-door reforms. Indeed, Ōhira’s choice of foreign minister was the former lead planner of the Economic Planning Agency, Ōkita Saburō [大来佐武郎], who subsequently became advisor to the Chinese government. The Finance Ministry had also set up a group to re-examine the Nishihara Loans in the 1960s and came to favourable conclusions.
Deng himself had been a product of the First World War, soon after which he was chosen to study and work in France, following the example of the Chinese laborers sent there during the hostilities. He returned from France as a radical, joining the CCP as well as the Kuomintang. In 1928 the Beiyang Regime fell to Kuomintang troops, which had received Soviet support. Despite a fall out in 1927 with the Communists and a decade-long purge of the left, the Stalinist model also came to inspire the Kuomintang single-party regime, which announced a Five Year Plan in 1930 and a Four Year Plan in 1932. Both came to nothing. Regional warlords such as Yan Xishan [閻錫山] started to propose plans for single provinces. China reclaimed the right to set its customs tariff rates in 1933. By 1934 the Kuomintang had decided on a Planned Economy, and started a “National Economic Construction Movement.” In 1935, ex-Beiyang technocrats Ding Wenjiang and Weng Wenhao were named leaders of the “National Resources Commission” (NRC 國民政府資源委員會) which was placed in control of most of the state-owned industries. With Nazi assistance they produced in 1936 a “Heavy Industrial Development Five Year Plan” which focused on defense industries and electricity, until it too was cut short by Japanese invasion.
As early as 1946 Weng Wenhao announced that the work of the NRC was to build up state capital, conforming with international socialist tendencies. They had also inherited many of the Japanese staff, and the huge industrial complexes built by the Japanese authorities, in North China and Manchuria. The NRC thus became a left-wing bastion within the anti-Communist regime which fell in 1949. Around 90 percent of the NRC’s staff subsequently defected to the new Communist regime. Some remained on the frontlines of economic reform until the 1980s. One of them, Qian Changzhao [錢昌照] even helped plan special economic zones and write Hong Kong’s Basic Law. Others went to Taiwan, and although some of them were executed for their Communist sympathies, the island ultimately blossomed under what the Kuomintang termed a “Planned Free Economy” [計劃自由經濟], merging state-direction with market mechanisms.
It has often been argued that China, since the reforms of the 1980s, has abandoned revolutionary socialism. There is consequently little consensus as to what China has now really embraced in its place. What the history of planning in the region suggests is that China’s model owes much to this older ideology of State Socialism. Even today, the legacy of State Socialism and the Saint-Simonian spirit can still be felt in the 14th Five Year Plan, now under execution in China, and its “Belt and Road Initiative,” which aims to link up the world with rapid infrastructural development. It is also instructive to note that Japan’s late-1980s economic bubble and the subsequent “lost decades” coincided with the dismantling of economic planning and controls, whilst South Korea after the 1997 financial crisis has strengthened economic controls.
Yet the legacy of the East Asian variant of State Socialism, with its dedication to the cause of industrialization combined with near total neglect for social welfare, haunts the region. Worker protests continued to grow throughout the 1980s–90s. Recent decades have seen the institutionalization of comprehensive systems of medical insurance, and increased resources devoted to environmental protection. Understanding the origins of East Asian developmentalism allows us to effectively situate these efforts within a broader struggle for development, and to see how East Asia, often thought of as an exception, is but an integral part of the global evolution of economic policy.
A follow-up report, released April 2022, investigates the prevalence of misleading cost practices at elite private colleges. Read the report here.
The deceptive financial aid system at America’s colleges
When prospective students navigate the process of choosing a college, financing is a central and often determining factor in the final decision of enrollment. Students first turn to college websites and the College Scorecard to look at cost data, and many then apply for financial aid through FAFSA,1(<)meta charset='utf-8'(>)Both websites handle financial aid data that was calculated and reported directly by the higher education institutions. Though data at the student and program level is private, the institution level is made public through the (<)a href='https://nces.ed.gov/ipeds/use-the-data'(>)Integrated Postsecondary Education Data System(<)/a(>) (IPEDS). The analysis presented here utilizes the IPEDS data and is focused on 2-year and 4-year institutions that are Title IV participants, excluding exclusively online institutions. which relies on cost estimates provided directly by colleges to determine aid packages. Prospective students know that college is a steep investment—they take seriously the decision of where and what to study and the costs it incurs. No matter how talented, hard working, and committed a student is, if financing falls through, the dream of obtaining higher education can be dashed. But much of the financial data that prospective students receive is misleading. In the cost information offered to prospective students, higher ed institutions consistently underestimate the non-tuition costs of attending college, and overestimate the amount of incoming aid from grants and scholarships. Discrepancies between estimated and real prices can add up to thousands of dollars in unanticipated costs, burdening students who already struggle to afford college.
In our research, we find that 41 percent of colleges underestimate room and board costs for off-campus living, with a median difference between real costs and estimates of $1,488 for public colleges and $2,045 for private colleges. Similarly, we show that students can expect to receive an average of $3,000 less in free aid as upperclassmen versus their first year of college. Overall, 83 percent of higher education institutions in the academic year 2017–2018 presented information that obscured similar reductions in financial aid for upperclassmen.
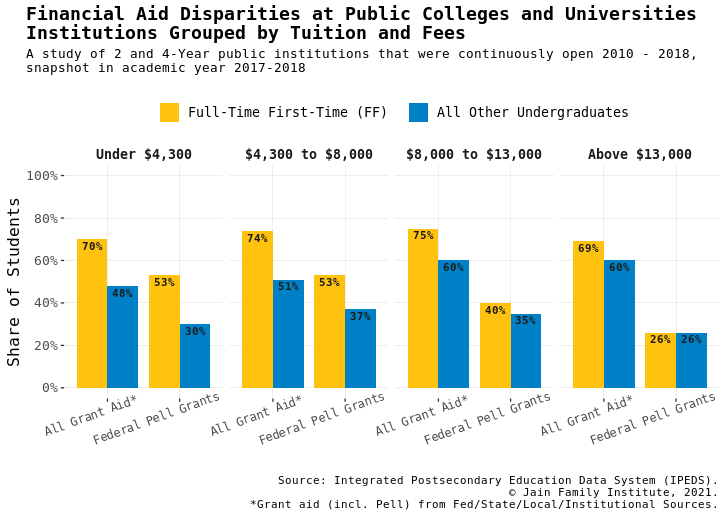
Students who have more financial flexibility to deal with the fallout caused by decreased aid packages and underestimated costs are more likely to continue at the same college in their second year. Some continue only because of student loan limits that increase as they advance through their degree, which colleges consciously plan for when reducing financial aid packages for upperclassmen. But the squeeze caused by unexpected high costs leads many students to drop out or transfer. The aggregate cost data that universities offer prospective students conceals the reductions in aid packages as students advance because it focuses solely on first-time full-time students.2(<)meta charset='utf-8'(>)First-time means no prior postsecondary experience. It includes students who entered college in the prior summer term and students with advanced standing due to college credits earned in high school. For low- and middle-income Americans, securing financial flexibility to continue college is largely dependent on whether or not they attend a college with lower tuition and fees, which are not subject to rampant underestimation. Lower price institutions, while taking an equal share of first-time students as their more expensive counterparts, enroll disproportionately more upperclassmen despite also presenting misleading data.
With each passing year, a greater share of students feel the effects of these oversights: dwindling grant or scholarship resources, student loan accumulation, and, in the worst cases, the inability to make ends meet when both tuition and cost of living continue to rise. The sticker shock of college hits hard once funding sources run dry, leaving a wide swathe of students worse for wear, through either unanticipated indebtedness of the student (and/or family through the Parent PLUS loan system) or delays and decline in college completion. The widespread misrepresentation of cost data exacerbates the harsh trends of the student debt crisis, by denying students and their families the information they need to make one of the biggest financial decisions of their lives.
Overestimating aid
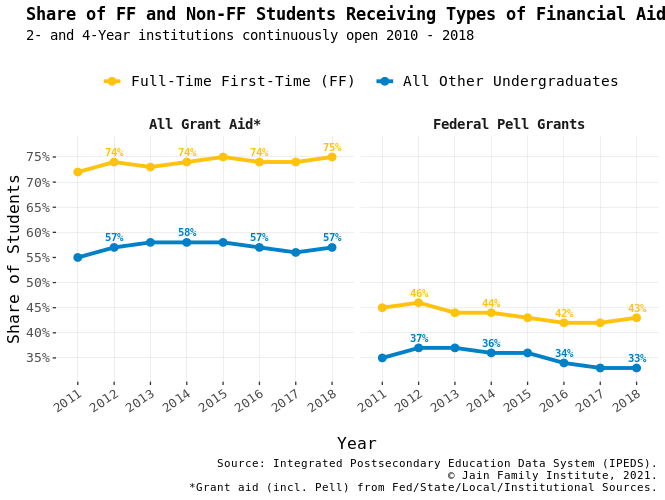
The cost increase that first-time full-time (or “FF”) students see in later years is known as “bait and switch” or “front-loading.” First-time students receive generous grants or scholarships in their first year of college which decrease or disappear altogether in the second year of college and beyond. In a 2015 Hechinger Report, researchers estimated that about half of colleges and universities front-load; by the academic year (AY) 2017–2018, that share had risen to 83 percent.3(<)meta charset='utf-8'(>)83 percent of 2- and 4-year colleges and universities in our study had a higher share of FF students receiving free grants and scholarships than the share of non-FF receiving the same type of aid. 75 percent of colleges and universities reported higher average free aid for FF students than non-FF students. The “bait and switch” has been experienced by millions of students, especially those who are low-income, but is overshadowed in the higher education discourse by the dual crises of rising costs and ballooning student debt. At the aggregate level, front-loading is happening at such high rates that we can easily see its impact.
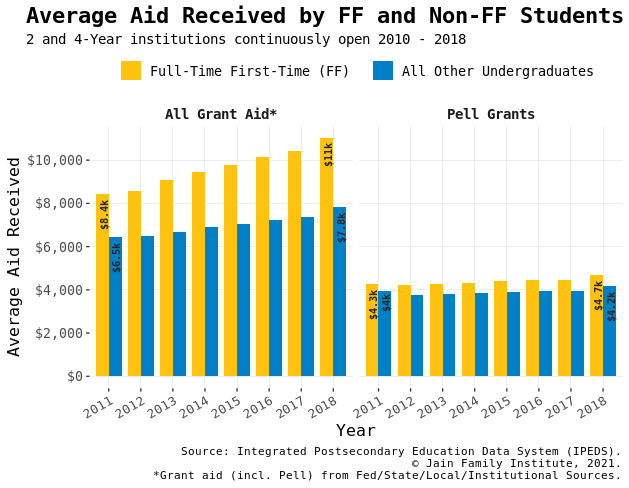
In every year of this analysis, from AY 2010–2011 to 2017–2018, the national average share of FF students receiving free aid was significantly higher than the share of non-FF students receiving the same type of aid. Most recent data shows FF students receiving, on average, over $3,000 more in free aid than all other undergraduates. Given the data, the student body makeup for FF students is visibly different than for other undergraduate students—there are significantly fewer Pell grantees in the latter group. If the proportion of Pell grantees in the student body and the average Pell grant decreases as an entering cohort ages in a particular institution, it signifies that lower-income students are dropping out at disproportionate rates.
Institutions front-load free financial aid in the first year of school, likely as a means to compete to enroll college students upfront. They bank on the premise that once students enroll for the first time, the college will face less competition from other universities should the cost of attendance increase. Knowing that continuing students are already invested in finishing a degree at their respective institution, colleges decrease aid packages in later years. In fact, the difference in average free aid for FF and all other undergraduates has been widening over the last several years as colleges further invest in front-loading. The trend is clear across all higher education institutions, including less expensive and less selective public colleges where poorer students are more likely to attend. For those types of schools, price is a selling point, so the incentive to front-load is even higher. Put simply, colleges are leading students on about the price of college.
When students have grant and scholarship aid removed in the second year of college, their only options are taking out (more) student loans, making up the cost difference with family or personal savings, or altering college plans by taking time off or transferring schools. Our research proves the latter options—which delay college completion—are happening at an alarming rate. A selection effect ensues: students with better aid packages and/or more financial flexibility are more likely to continue their program. The lower the cost of college, the less drastic the selection effect. Thus, less expensive schools, despite front-loading proportionally more, allow students greater financial flexibility to continue in college because they offer lower prices than their counterparts at more expensive colleges.
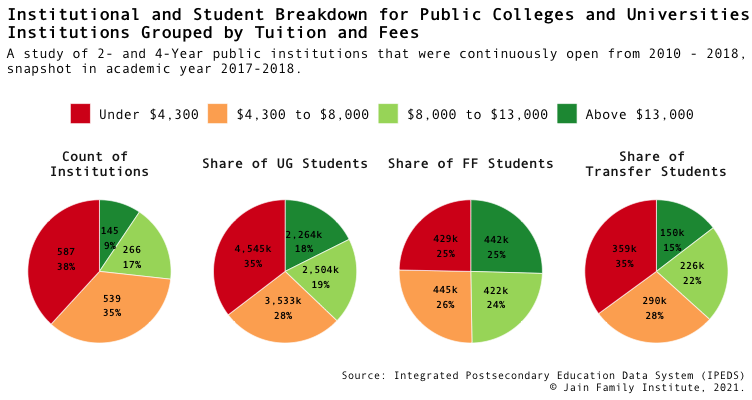
Regardless of its severity, the selection effect is seen nationwide as a result of front-loading. With many students enrolling due to generous aid packages, expensive schools see high headcounts of FF students, so the weighted average of tuition and fees among the national population of FF students skews higher with their inclusion. When that aid is reduced, students may drop out and potentially transfer to less expensive colleges, paying lower tuition and fees in the following year. These less expensive colleges, less prone to the selection effect because they have lower prices, now include a higher proportion of students when calculating the average tuition and fees for the undergraduate student body as a whole.
As a result of the selection effect, the national average tuition and fees is always higher for FF students than for all undergraduates. The differential is not due to upperclassmen receiving more generous aid packages (in fact, the opposite is occurring, as referenced in tables previously). Instead, after their first year, many students at expensive schools drop out entirely or possibly transfer to less expensive schools; at the same time, the largest portions of transfer students4(<)meta charset='utf-8'(>)Annual enrollment data at colleges includes statistics on transfer students. We cannot see which colleges students are attending before transferring nor whether they took time off before enrolling at their new institution. We also cannot tell the income-level of the transfer student. are filtering into lower-priced schools. The enrollment shares decrease at expensive schools when looking at FF to total undergraduates and increase at less expensive schools.
Weighted Average Tuition and Fees for the Academic Year at 4-Year Institutions
Academic Year
First-time Full-time Students
All Undergraduates
Price Differential
2010–2011
$15,208
$13,560
$1,648
2011–2012
$15,982
$14,265
$1,717
2012–2013
$16,770
$14,878
$1,892
2013–2014
$17,324
$15,390
$1,934
2014–2015
$17,879
$15,797
$2,082
2015–2016
$18,450
$16,234
$2,216
2016–2017
$18,800
$16,364
$2,436
2017–2018
$19,340
$16,778
$2,562
2018–2019
$19,994
$17,249
$2,745
Weighted Average Tuition and Fees for the Academic Year at 2- and 4-Year Institutions
Academic Year
First-time Full-time Students
All Undergraduates
Price Differential
2010–2011
$11,365
$9,065
$2,300
2011–2012
$12,134
$9,648
$2,486
2012–2013
$12,822
$10,156
$2,666
2013–2014
$13,262
$10,580
$2,682
2014–2015
$13,852
$11,021
$2,831
2015–2016
$14,387
$11,390
$2,997
2016–2017
$14,907
$11,784
$3,123
2017–2018
$15,418
$12,146
$3,272
2018–2019
$16,028
$12,581
$3,447
Statistics are based on Title IV participating colleges, excluding online institutions, open in each respective year. For each public institution, we recreated a weighted average tuition and fees variable for FF students that was weighted on the number of in-district FF students paying in-district tuition and fees, the number of in-state FF students paying in-state tuition and fees, and the number of FF out-of-state students paying out-of-state tuition and fees. The same was done to create a tuition and fees variable for all undergraduate students. Mostly the above specific calculations only apply to public colleges. Private colleges generally apply the same tuition and fees regardless of residency status. To calculate the weighted averages seen in the tables, we take each university variable and weighted it by the number of total FF students or total undergraduate students, respective of the variable at hand.
Despite nearly every institution reporting that tuition and fees paid by FF and all undergraduate students are similar, if not identical, the large difference in average prices faced by these groups (when weighted accordingly) signal that the students that persist in their four-year degree are those that face lower prices. The discrepancy is the direct result of colleges competing for (in-state and out-of-state) students by offering generous aid packages that fail to materialize in similar fashion after the first year of college. Whether intentional or not, this scheme is taking the non-profit and public higher education space by storm, entirely at the expense of students. Students must transfer out or drop out entirely, impeding college completion and placing a significant strain on first-year students, especially those who are low-income. Fortunately, however, the analysis sees less expensive institutions receiving the overwhelming majority of transfer students each year, especially public institutions which offer students the best chance to recuperate their educational investment.
This is not a new trend, but it has gotten worse over time as college tuition and fees have risen for first-time students (see above table). The “Price Differential” that FF students face has increased 77 percent at 4-year institutions, from $1,648 in academic year (AY) 2010–2011 to $2,745 in AY 2018–2019. This phenomenon occurs in spite of large-scale for-profit closures that boost the overall student body percentage attending relatively cheaper public colleges, both for FF and the student body as a whole. That’s because even public institutions are underplaying the costs of attending college to FF students. The figure below focuses on the selection effect at public institutions; the share of students attending expensive public colleges drops considerably when comparing FF students and the transfer and undergraduate student body as a whole.
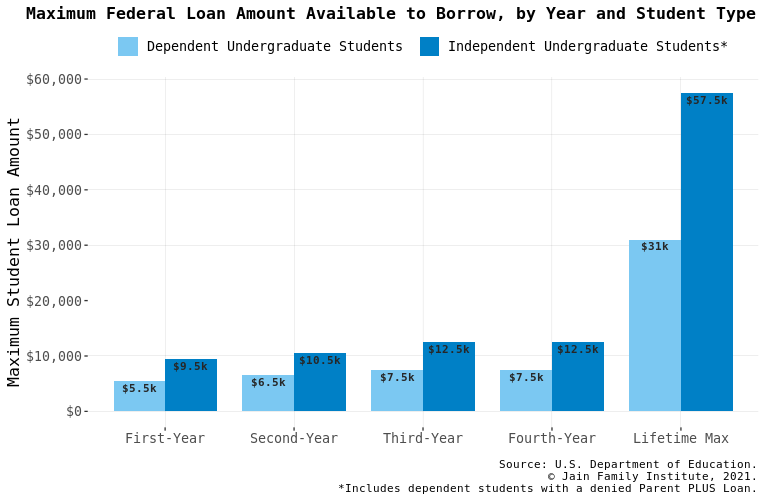
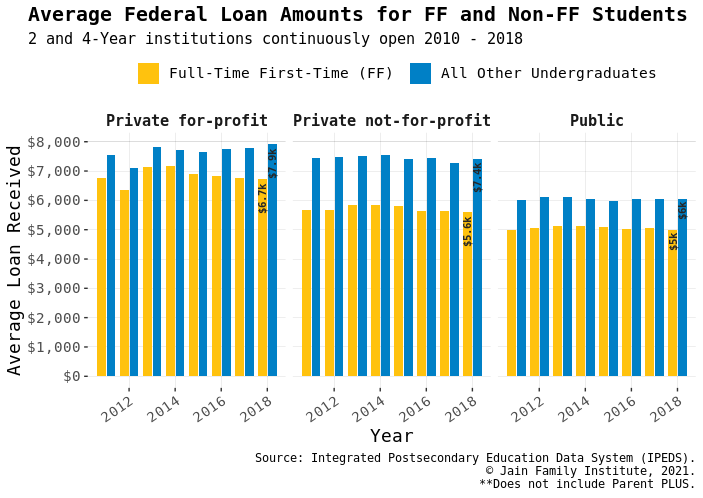
The high prevalence of large student loans amongst FF students, especially in relation to the maximum allowed for first-year dependent students, $5,500, is another sign that finances are at the forefront of college persistence—these students may have borrowed more than the maximum allowed if given the chance.
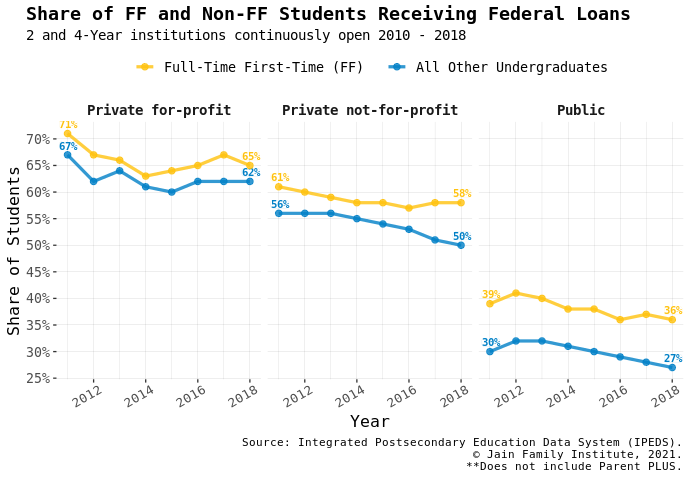
Additionally, relatively fewer students taking out federal loans after the first year of college (seen in the chart below) indicates that the neediest students are not returning for the second year of college. Those who drop out must start payments despite not obtaining the credential; $5,500 in student loans taken out for a FF student in AY 2020–2021 translates to $600+ owed in payments per year.
Returning students have already made a huge investment in time and money. Those who do remain past the first year of college and take out loans increase not just their total loan burden, but also their annual loan origination amounts, as the federal loan maximum for later years in college also increases. In fact, increased federal loan limits in later years are crucial to schools’ front-loading schemes. Aligning with increased borrowing limits in later years, schools reduce free financial aid for those years, allowing the gap to be filled by larger loan burdens on the students. Colleges capitalizing on the student loan system is the norm, even at the richest universities in the country.
Underestimating costs
Based on the above data, we know that colleges downplay the costs of college for upperclassmen, only presenting front-loaded statistics to prospective students. Unfortunately, the misleading practices don’t end there. Other major college costs, including housing, healthcare, food, travel expenses, and supplies require estimations calculated by the institutions themselves. Colleges do not have these estimations audited and, in a bid to present as more affordable, generally underestimate these costs, if they provide them at all. Some expenses, like healthcare and computer purchases, are entirely excluded; estimates for line items like books, supplies and transportation are typically not sufficient to cover real world costs; room and board costs are assumed to be \$0 if the student lives with family; and if students do not live with family, estimates assume that they are sharing a bedroom.
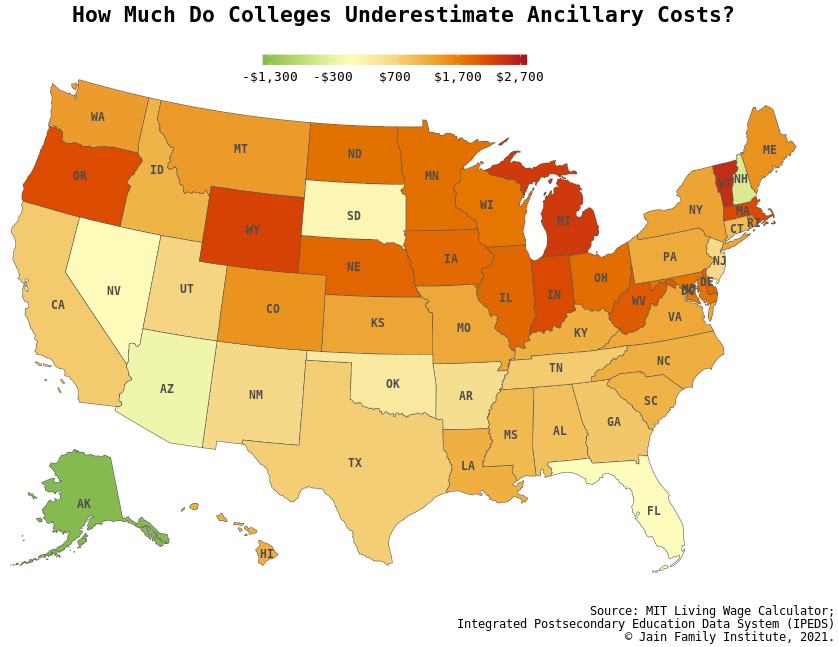
Using a 2017 dataset from MIT’s Living Wage Calculator, we can make local-level comparisons between off-campus cost estimations reported by schools for FF students and those reported by the calculator for a single adult with no children.5(<)meta charset='utf-8'(>)Comparing data from AY 2016-2017 for 2- and 4-year institutions, excluding online institutions, to 2017 MIT Living Wage Calculator data. The Calculator’s cost data is reported for a 12 month period; to properly make comparisons, Calculator data was computed to a 9 month value.The analysis shows that 41 percent of colleges and universities in AY 2016–2017 underestimated the costs of room and board for off-campus living. For those schools, the median discrepancy between room and board estimates and realistic costs was $1,488 for public colleges and $2,045 for private colleges. Given that 53 percent of FF students that received Title IV federal aid (loans included) in AY 2016–2017 lived off-campus, and that percentage is likely higher for non-FF students, these underestimations hold deep consequences for students with financial need.
Estimated costs for off-campus “laundry, transportation, entertainment, and furnishings,” known as ancillary costs, only increased 3 percent between AY 2010–2011 to AY 2016–2017 ($3,685 to $3,797)—these are, unsurprisingly, underestimated.
In our analysis we find that 69 percent of institutions underestimate off-campus ancillary costs like transportation, clothing, and furnishings. The median discrepancy between institutions’ estimates and realistic costs is $1,665 for public colleges and $2,044 for private colleges. Of that 69 percent, over half of the colleges underestimate ancillary costs by more than 25 percent, a shortcoming of more than $1,380 dollars per academic year at nearly 2500 colleges. The discrepancies are severe, and they are not the result of student discounts unaccounted for by the Calculator. These discrepancies have an additional consequence for financing—insufficient estimates are used during the FAFSA financial aid process to determine cost of attendance. Though students can appeal to financial aid offices on need-based aid and student loan eligibility, they cannot change the school’s estimates for costs.
Net price calculators at colleges across the country generally exclude healthcare entirely, but institutions still require students to be insured, and healthcare costs continue to appear on tuition bills (a waiver is required to remove the cost). The insurance requirement may result from an assumption that enrolled students can be carried on their parents’ or spouse’s plan, but this also assumes that parents are insured, students are under 26, and parents can afford to continue paying premiums for students long after they become adults. The alternative is healthcare provided by the institution itself. These plans are very expensive, of poor quality, and generally not considered in students’ college decisions. Moreover, many institutions impose stringent requirements on external plan coverage; some students are required to pay for institutional healthcare despite being covered under family plans. With the median healthcare cost for nine months computed with the Calculator data being $1,724, the added expense imposes a significant burden on students, who don’t receive this cost estimate before enrolling.
Institutions are increasingly moving to eliminate the secondary market for textbooks. More often than not, students have to purchase unique credentials for electronic material to access online videos, tests, or quizzes that track their progress for credit. This essentially translates into a per-course fee that some worry will rise once competition from bookstores falls. Textbook publishers, in turn, fight to maintain sales by offering online learning tools via unique access codes, which also track the student progress for credit. Unlike hardcopy textbooks, e-learning codes regardless of seller cannot be resold at the end of the semester like a student would with hardcopy textbooks. E-learning tools are expensive and relatively new to the higher education scene, but estimated costs for books and supplies increased only 5 percent between 2010 and 2017 (from $1,216 to $1,274 at the same 4-year institutions). It’s unclear if these estimates include e-learning costs, however, students do take textbooks and access code costs into account when choosing courses, or even skip buying them altogether to the detriment of their grades. The dominance of access codes also implies reliable internet access, another line item not included on college net price calculators.
Conclusion
Prospective students are presented with huge amounts of data when deciding which college to attend. But much of this data is smoke and mirrors. Many colleges intentionally deceive and confuse students about the costs of college and the availability of aid. Students, especially those with fewer financial resources, unknowingly start off on the wrong foot. College brochures leave out crucial details—that borrowing students are likely to max out federal loans each year, that the only alternatives are more expensive Parent PLUS or private loans, and that the majority of students receive less generous aid packages as soon as their second year of study. Information on program-specific outcomes, like drop-out or graduation rates, is sparse and hard to access, let alone such data specific to the income level of the student. This data is absolutely necessary for prospective students to make rational decisions about college attendance. Asymmetric information between institutions and individuals is hurting the latter.
The insufficient and at times deceptive data prevents students from making the best decision about college. Even trying to establish the tuition growth rate over the past four years is difficult for someone not well-versed in college financial aid jargon. Young people have been told to make the investment in higher education, but the lack of big picture financial information to choose the right program means a much larger financial risk. Veterans, for example, are preyed upon by low quality schools, but there’s little data and policy to keep these schools accountable and to inform prospective students of poor outcomes. The Senate’s bipartisan bill to protect G.I. Bill beneficiaries, introduced in May of this year, specifically seeks to counter data gaps and provide more relevant information to veterans to strengthen successful collegiate outcomes. This is a step in the right direction, but it’s needed across the spectrum of higher education, especially when the full spectrum is operating in a for-profit manner. The call for better data is echoed in equity research and in post-graduate higher education as well.
The reality is that unforeseen funding challenges of college, including those as simple as gradual tuition increases, bring up concerns around college completion, burdensome debt accrual, or both. As a first step towards completing college and obtaining a credential in an unaffordable higher education sector, prospective students must understand and anticipate the dollars to be paid. The limited number of comparisons available in this report most likely just scratches the surface of the broad deception that characterizes college cost calculators and aid packages. Policymakers must respond to the rise in college costs and work quickly to tame the corporate profitization in its myriad of forms—it’s necessary to preserve education as a tool for individual and societal success.
Special thanks to Elizabeth Cornell-Khan, Raquel Merced, Adamma Morrison, Zyris Shakir, and Eddie Nilaj for their data research and expertise, without which this report would not have been possible.
A follow-up report, released April 2022, investigates the prevalence of misleading cost practices at elite private colleges. Read it here.
We live in the age of the central bank. The financial crisis of 2008 and the COVID-19 crash of 2020 have made visible the central role of the US Federal Reserve and its overseas counterparts in the international financial system. The tasks of central banks are dramatic—rescuing banks and preventing financial collapse—and have earned them applause for avoiding a second and third Great Depression, and have brought relief to the economy. But these actions bore a distributional impact. Most of the financial policies adopted in response to the crisis—quantitative easing, bond purchases, and low interest rates—have protected wealth without creating new opportunities for those who don’t possess it. As the “K-shaped” charts of the 2020 recovery made plain, a market rebound did not spell economic well-being for ordinary people.
The outsize role of central banks—especially the Fed—in the international financial system has led to some skepticism about central banks and their independence. Central bank independence (CBI) grants the Fed immunity from public accountability and political interference. The Fed’s position as an independent authority in an internationally integrated market has allowed it to play, outside national borders, lender of last resort: extending liquidity assistance to foreign central banks through currency swap lines without requiring Congressional approval.1(<)meta charset='utf-8'(>)The main purpose of these lines was to protect US markets from pressures abroad in a manner that allowed the central bank to play its role as the lender of last resort domestically, but in an internationally integrated financial market. (See William C. Dudley’s (<)a href='https://www.newyorkfed.org/markets/statement_0105_2012.html'(>)Letter to the Editor(<)/a(>) in the Wall Street Journal, January 5, 2012.) Since the 1970s, CBI has been justified using the language of credible commitment and the assumed apolitical nature of monetary policy. Protection from public pressure is thought to allow central bankers to act in accordance with the principles of economics to make policies which are “confidently expected to work.”2(<)meta charset='utf-8'(>)Paul Tucker, “Appendix: The Principles for Delegation to Independent Agencies Insulated from Day-to-Day Politics,” Unelected Power (Princeton: Princeton University Press, 2018), 569–572.
From the point of view of the public, the claim of political-economic neutrality may be harder to believe. While CBI is meant to shield monetary policy from partisan politics, central banks are political institutions in a relatively straightforward sense; central banks protect the interests of creditors over those of debtors, for instance. In guaranteeing the actions of private banks, central banks have allowed and encouraged them to engage in risky and reckless practices. As the 2008 crisis showed, this has occurred at the expense of members of the general public, many of whom received no bailout after losing their homes and incomes.
Central bank independence today may be something of an anachronism. As policy, CBI was formally instituted in many Western economies in the 1990s and is often associated with the “Third Way” policies that dominated that decade. But CBI has a much longer history. Tensions between democratic governance and central banking date back to the early twentieth century, when two key factors shaped the development of central banks as we know them today. The first was the founding of the Federal Reserve System in 1913. The second was the partnership between the heads of the world’s dominant central banks: Montagu Norman, the governor of the Bank of England; and Benjamin Strong, the governor of the New York Fed. Together, they cemented the interests of central banks with those of private finance, and regularized independence and cooperation in a manner that evolved at odds with democratic governance.
The Federal Reserve System was born out of the realization that the state should not rely on private financiers, such as J.P. Morgan, to stem financial crises like the Panic of 1907. Like many of its European counterparts, the Fed was privately owned and accountable to its directors and shareholders—private bankers. This constellation of power gained significance in the aftermath of World War I, when central banks came to carry “virtually the whole responsibility of maintaining economic stability.”3(<)meta charset='utf-8'(>)Alfred Hayes, 1967 foreword to Central Bank Cooperation: 1924–31, by Stephen V. O. Clarke (New York: Federal Reserve Bank of New York).
It’s within this context that Norman and Strong, both former private bankers now in charge of the world’s foremost central banks, laid the groundwork for the two principal practices that characterize modern-day central banking: independence and cooperation. Their vision was put down by Norman in a 1921 manifesto detailing central banking principles:
Autonomy and freedom from political control are desirable for all Central and Reserve Banks.
Subject to conformity with the above clause a policy of continuous cooperation is desirable among Central and Reserve Banks. 4Richard Sydney Sayers, The Bank of England, 1891–1944: Appendixes (Cambridge: Cambridge University Press, 1976), 75.
But these views emerged in a context very different from the prewar years. Around Europe, growing labor movements and the expansion of the vote sparked fears of political and economic instability. Operating in a decidedly more democratic postwar climate, central bankers grew wary of government interference in economic matters. In interviews with Bank of England historian Richard Sayers, several of Norman’s colleagues relayed Norman’s distrust in governments and his efforts to keep them from interfering at the Bank. One associate told Sayers that Norman often said, “the Treasury is your worst enemy. Inflation always comes from the [governments].”5(<)meta charset='utf-8'(>)Interview with Mr. F. Conolly, May 29, 1970, Richard Sydney Sayers Papers: Records of Interviews, 1969–1971, file ADM/33/26, Bank of England Archive, London. Distance from governmental interference gave central banks greater credibility among their foreign peers. Indeed, in 1921, the Reichsbank of Germany was discredited for yielding to political influence over economic and monetary matters, and for being too close to the government.
In the period of postwar economic rehabilitation, these sentiments were shared around the globe. In 1921, Strong wrote to Innouye Junnosuke at the Bank of Japan about governments’ roles in postwar economic rehabilitation: “I must say quite frankly that I dread the point of view of politicians in these matters, and if I must say so without discourtesy to people of such importance, I dread their blunders in economic matters.”6(<)meta charset='utf-8'(>)Benjamin Strong, (<)a href='https://fraser.stlouisfed.org/archival-collection/papers-benjamin-strong-jr-1160/correspondence-japan-473571'(>)Correspondence with Bank of Japan, Governor, Junnosuke Inouye (1920–1927)(<)/a(>), file 1330.1.1, Benjamin Strong Papers, Strong to Inouye, November 17, 1921, FRASER Digital Library of the St. Louis Federal Reserve.The publication of Norman’s manifesto coincided with several informal conversations between Strong and Innouye on the formation of “a better understanding between principal banks of issue.”[^Ibid] Strong had the same conversation with Charles Addis, the leading director of the Bank of England and the head of Hong Kong and Shanghai Bank. These principles became formally recognized at the 1922 Genoa Conference, where the Report of the Financial Commission recommended that “‘banks of issue should be free from political pressure’ and that the financial system would be managed with the ‘practice of continuous cooperation among central banks of issue.’”7(<)meta charset='utf-8'(>)(<)a href='https://fraser.stlouisfed.org/files/docs/publications/FRB/pages/1920-1924/26565_1920-1924.pdf.'(>)Genoa Financial Commission Report(<)/a(>), 1922, FRASER Digital Library of the St. Louis Federal Reserve. In line with these resolutions, in 1925, Norman wrote to Strong of his hope to “inaugurate [a] private and eclectic Central Banks’ ‘Club,’ small at first, large in the future.”8(<)meta charset='utf-8'(>)Gianni Toniolo, (<)em(>)Central bank cooperation at the Bank for International Settlements, 1930-1973(<)/em(>) (New York: Cambridge University Press, 2005), 30.
To form international cooperation, the participation of the US would have been crucial, but Strong opposed any type of formal meeting of the world’s central bankers. Instead, he adopted a more ad hoc, hub-and-spoke approach to cooperation, limited to a small number of central bankers. Inclusion in international cooperation was selective, and issues were dealt with one at a time.
The practice of ad hoc cooperation continued throughout the 1920s, and regularly did so under the radar, in secret and secluded meetings.9(<)meta charset='utf-8'(>)The most infamous of these secret meetings was the Long Island meeting in 1927 at the estate of Ogden Mills. For five days, they talked of monetary policy adjustments to meet gold requirements. No official record of this meeting was kept.Such meetings were normalized in the Bank for International Settlements (BIS), created in 1930 to realize Norman’s wish “to make an umbrella, so that we can all get under it when it rains.”10(<)meta charset='utf-8'(>)Interview with R.N. Kershaw, March 27, 1969, Richard Sydney Sayers Papers: Records of Interviews, 1969–1973, file ADM/33/25, Bank of England Archive, London. To draw the institution’s statutes, Norman recruited Walter Layton, then editor of The Economist, and pushed him to “work out some form of words that would place the bank beyond the reach of governments.”11(<)meta charset='utf-8'(>)Andrew Boyle, (<)em(>)Montagu Norman: A Biography(<)/em(>) (London: Cassell, 1967), 247. Layton opposed this policy “because it’s the right of every democratic government to reserve its freedom of action,” but eventually admitted defeat.12Ibid. The idea was materialized in the Bank’s constitution. Over the decades that followed, this umbrella bank evolved into a preferred locus for central bank cooperation and diplomacy, offered central banks respite from political interference, and helped them secure their independence from governments.
The Norman-Strong partnership made a practice of bailing out domestic banks and private banks abroad throughout the 1920s, thereby setting a precedent of protecting wealth. Their autonomy allowed them to engage in international cooperation. In addition to the more routine types of cooperation like information sharing and standard setting, the Bank of England and the Fed extended, throughout the decade, large and long-term credits to central banks abroad in the face of financial pressure and for the purpose of currency stabilization. Such cooperation broke down with Strong’s sudden death in 1928, when central bank assistance to other central banks to maintain their currencies shifted toward more isolationist and nationalist policies. With the Norman-Strong partnership gone, even the Bank of England and the Fed were less willing to go more than halfway to help one another. This turn toward isolationism occurred more or less on the eve of the 1929 stock market crash, further impeding cooperation when faced with the Great Depression, a calamity that has been deemed a failure of central banking.
Although central banks have been nationalized since the interwar years, they continue to follow the precedent set by their forebears. About a hundred years after Norman and Strong reshaped central banking, central bankers in 2008 navigated the crisis in their predecessors’ shoes, bearing in mind the consequences of inaction from the 1930s.
The privileges of central banks only grow in times of crisis. Just over a decade ago, central bankers issued swaps overseas, some argue, without clear legislative authority to do so. While these measures were not unlawful, they stretched the boundaries of central bank jurisdiction overseas, further distancing central banks from the citizens to whom they ought to be accountable. Importantly, their policies continue to protect the interests of the financial sector over those of the public. When the 2008 crisis hit, central bankers at the Fed, like their 1920s predecessors, took dramatic steps to bail out large financial institutions, consequently reinforcing and expanding existing wealth disparities and undermining a key justification for CBI: monetary policies do not have distributional effects.
In response to the pandemic, central banks have been forced to take even more dramatic steps to meet the needs of the broader public than they did in 2008, such as direct lending to state and municipal governments and supporting loans to small and midsize businesses and NGOs. Expanding mandates to include financial stability (as at the Bank of England), and increased communication with the public on significant policy decisions also suggest a shift toward greater transparency.13(<)meta charset='utf-8'(>)Such as the (<)a href='https://www.federalreserve.gov/monetarypolicy/review-of-monetary-policy-strategy-tools-and-communications-fed-listens-events.htm'(>)Fed Listens(<)/a(>) initiative. But questions of legitimacy still loom large. Increased communication from central banks may make central bank practices less mysterious, more accessible, and more informative for the broader public. But these changes do not resolve the fundamental lack of accountability at the heart of central bank practices.
The world’s leading central bankers designed and instituted policies and practices of independence which facilitated international cooperation without governmental interference in the early 1900s. Over time, these practices have embedded central banks’ interests and goals with those of the wealthy. But had central bankers prioritized the economic needs of ordinary citizens a century ago, would the distributional consequences of monetary policy—the exacerbation of wealth inequality across society and across generations—have gone a different way?
When the next financial crisis comes around, we will need central banks to take extensive action. And in 2020, central banks certainly did pay closer attention to the needs of the wider citizenry. But as they seek to close the legitimacy gap today, they must confront the long history of their democratic deficit. In addition to protecting wealth, they will need to address the inequities generated by their policies and reorient their goals to serve the interest and needs of the broader public. This would mean dislodging themselves from century-old ideas, interests, and practices that today remain intertwined with the interests of private capital and wealth, unaccountable to the public, and incompatible with democratic politics. Effective policies—and the confidence that they will work—are undoubtedly desirable goals. The question that central banks need to ask is: for whom are these policies effective?
As the American economy reopened in the first half of 2021, reports of a “labor shortage” spread throughout US industries. But there was one sector where employer panic about hiring was old news: the massive and decentralized US construction industry. According to industry surveys, the share of homebuilders who rank the “cost and availability of labor” as their most significant problem has increased every year since 2011. This summer, the complaints continue.
What can construction tell us about the increasingly widespread idea of a “labor shortage”? Mark Erlich, the former Executive Secretary-Treasurer (EST) of the New England Regional Council of Carpenters, now a fellow at the Harvard Labor and Worklife Program, laughs at employer claims: “Labor shortage” has been a “chronic cry for decades. And yet somehow there always seems to be enough labor to get the job done.” Even at low wages, employers have been able to find someone to risk their lives on a job (in a pinch, there’s always prison labor).
But in another sense, the employers’ complaint illuminates a real dilemma. Since the 1960s, the construction sector has undergone a profound transformation in business practices. Most importantly, once-powerful building trades unions have been sidelined from the cities that have grown fastest over the past generation. From a high point of 80 percent of construction spending during the early 1970s, the share of projects taken by unionized firms has collapsed to some 20 percent today. One consequence is the erosion of occupation-specific apprenticeship programs—funded by employers and administered jointly with unions—that once renewed the industry’s pool of skilled labor. As industry veteran Erlich explains, “The nonunion sector has never figured out a pipeline for training for bringing people into the industry.” Understanding this dynamic can help us move beyond a mechanical image of “labor shortages”—too much demand, too few unemployed—toward a richer understanding of the institutions that reproduce the labor force and determine its compensation.
Training expenditures are just one of the traditional obligations that construction employers have been able to shed. To a striking extent, many builders have ceased to be legal employers altogether. They were the pioneers of the “gig economy” model, in which employees are transmuted into “independent contractors,” so that employers no longer have to honor the protections of labor law or contribute to public social insurance or private supplementary benefits. Despite its dubious legality, the cost advantages of the model have made it increasingly attractive for other industries. Famously, Obama-era growth companies such as Uber and Postmates reimagine every worker as an entrepreneur, so that there is no need for companies to internalize the costs of wages or social insurance—much less education and training. As greater shares of the American economy take on aspects of the construction industry, we would do well to consider its precocious example.
The Downward Spiral
Construction is the only goods-producing industry in the country whose share of total employment actually increased over the twentieth century. Today between 7.5 and 11 million workers (about 1 in 14) claim construction as their primary employment. In the post-World War II period, it has absorbed a steady 40 to 50 percent of US gross private investment. Alongside this continued centrality, the industry has been the site of a thorough restructuring of business practices and labor relations.
The transformation began in the late 1960s, the last time US employers had to reckon with the consequences of full employment. During the Vietnam War, a booming economy coincided with the draft of young working-class men, leaving construction workers in an unusually favorable bargaining position. Their strength was reinforced by union representation, which then covered at least half of the industry.1(<)meta charset='utf-8'(>)Union density in the decentralized construction industry is notoriously difficult to measure accurately. Great Society-era surveys by the Office of Economic Opportunity found 47 percent of nonsupervisory construction workers were union members. Industry experts during the early 1970s put the share of the industry spending going to firms working under union agreements much higher at around 80 percent. (Unions find measures of market share a more meaningful indicator of organization than the number of workers who claim union membership on surveys; the large number of handymen, part-time, and self-employed workers who claim construction as their primary employment do not necessarily compete for the large contracts that drive the industry.)The Johnson administration’s wartime stabilization program had hinged on a voluntary national wage policy that would hold these union wages stable, while the boom raised the low wages in the disproportionately female and nonwhite service-sector, equalizing labor income across sectors. But as large companies refused comparable profit restraint, prices rose and real construction wages fell. Across the country, construction unions began to demand and win raises at higher rates than unionized manufacturing workers, not to mention the nonunion service sector. The tottering wage stabilization program collapsed.
In response, large international corporations, whose plant expansions made them major users of construction labor, launched a political project to transform the industry. Led by Roger Blough of US Steel; Virgil Day, Fred Borch, and Ralph Cordiner of General Electric; Charles McCoy of DuPont; W.B. Murphy of Campbell’s Soup; and David Packard of Hewlett-Packard, among others, the opponents of profit controls during the Johnson administration organized to apprehend the critically rising cost of new buildings. Just months after Nixon’s election, they formed the Construction Users’ Anti-Inflation Roundtable to agree to limits on the final construction prices their firms would pay, compelling contractors to draw the line against their unionized employees. “It’s time for a showdown,” said Chamber of Commerce president Winton Blount, himself the owner of an Alabama building contractor, one of the largest in the country.2(<)meta charset='utf-8'(>)“Attacking the Bargaining Crisis,” Engineering News-Record, May 30, 1968, p. 11, quoted in Marc Linder, (<)em(>)Wars of Attrition: Vietnam, the Business Roundtable, and the Decline of Construction Unions(<)/em(>) (2000), p. 182. Nixon appointed Blount Postmaster General, and during the administration’s wage-and-price stabilization program, the construction users’ group merged with an older association of HR executives from many of the same firms, the Labor Law Study Group, which had formed during the Johnson administration to protect Right-to-Work laws and lobby for tightening regulations against strikes. In 1972 the two groups merged to help put a ceiling on wages. They formed the Business Roundtable—originally called the Business Roundtable for Responsible Labor-Management Relations—to lead the push by Fortune 500 companies against the decade’s anti-corporate mood.
Today, the construction industry’s two major employer organizations reflect the success of that project. The Associated General Contractors of America (AGC), representing 27,000 firms including the unionized portion of the industry, is the older contractors’ association. It is rivaled by the Associated Builders and Contractors (ABC), an exclusively anti-union lobby representing 21,000 firms across 69 local chapters. The ABC benefited from the new period of business organization, doubling in size during the 1970s as population and investment shifted toward the Sunbelt, where unions were weak and nonunion construction was easily established as the norm.
The Business Roundtable and the shift in political power towards the Sunbelt states helped to defeat pro-union labor legislation in Congress in 1975 and 1977, tilting the industry firmly towards the nonunion model.3(<)meta charset='utf-8'(>)Gerald Ford had promised Labor Secretary John Dunlop to support common situs picketing for the construction industry, legalizing secondary boycotts on building sites by unions against subcontractors using nonunion labor. When Ford chief of staff Richard Cheney persuaded Ford to renege, Dunlop resigned. See chapters by Richard Cheney and John Dunlop in (<)em(>)The Ford Presidency: Twenty Intimate Perspectives of Gerald R. Ford(<)/em(>), ed. Kenneth W. Thompson (Miller Center for Public Affairs: 1988) Two years later, the Carter administration proposed and the House of Representatives passed the Labor Law Reform Act of 1977, which would have outlawed Right-to-Work laws, loosened regulations on unions, and expanded the National Labor Relations Board from five to seven members. Opponents in the Senate filibustered the bill, and the Carter administration failed to find enough votes for cloture before the second session ended in the summer of 1978. Melvyn Dubofsky, “Jimmy Carter and the End of the Politics of Productivity,” in (<)em(>)The Carter Presidency, Policy Choices in the Post-New Deal Era(<)/em(>), eds. Gary M. Fink and Hugh Davis Graham (University Press of Kansas: 1998), pp. 105-7. In contrast to the “union shop,” ABC member employers describe their model as the “merit shop”—meaning pay rates and benefits are determined unilaterally by contractors according to employee “merit” rather than union-negotiated pay scales. The Current Population Survey (CPS), which began asking respondents about union membership in 1971, found 42 percent of workers in all construction occupations belonged to unions, while the Bureau of Labor Statistics (BLS) found 60 percent of blue-collar construction workers were covered by collective-bargaining agreements that year.4(<)meta charset='utf-8'(>)The CPS, which is a household survey, includes many construction workers beyond the major commercial, industrial, and large-scale residential projects; the BLS Expenditures for Employee Compensation survey, which was terminated in 1977, was an establishment survey and presents a more accurate picture of union power in the highly capitalized core of the industry. By 1983, the CPS reported just 27.5 percent of workers in all construction occupations were union members, a figure that fell below 20 percent during the 1990s and today sits somewhere between 12 and 13 percent.5(<)meta charset='utf-8'(>)Government survey data in this paragraph is from Steven G. Allen, “Declining Unionization in Construction: The Facts and the Reasons,” (<)em(>)Industrial and Labor Relations Review(<)/em(>), Vol. 41, No. 3 (April 1988), and Richard B. Freeman and James L. Medoff, “New Estimates of Private Sector Unionism in the United States,” (<)em(>)Industrial and Labor Relations Review(<)/em(>), Vol. 32, No. 2 (January 1979). While industry employment continued to expand, the widening divergence in costs for employers between union labor and unorganized markets compounded these trends. In a highly competitive environment, nonunion employers are unable to pay for robust training programs—even if they wanted to.
Throughout the 1980s and 1990s, “merit shop” companies secured further competitive advantages by converting their workforce to independent contractors. This eliminated their employer contributions to Social Security and Medicare, and their workers’ compensation insurance policies. The Carter administration gave regulatory approval to this labor-market transformation when the Congress legislated Section 530 of the Internal Revenue Act of 1978. Further liberalized by the Reagan administration, the law allows employers to classify workers as independent contractors if a pre-existing pattern for contracting existed in an industry.
Long before the proliferation of app-based employment in transportation, the shift in the construction industry towards independent contracting by nonunion employers marked the emergence of the gig economy. The nature of construction work remained unchanged: subcontractors continued to direct the same structural, drywall, window framing, utilities, flooring or roofing projects on sites. But given the legal shift in tax collection and employment obligations, this massive shift towards “self-employment” represented the de facto toleration of widespread payroll fraud. State workers’ compensation programs lose as much as \$1.74 billion annually to such payroll misclassification, according to a 2020 study sponsored by the United Brotherhood of Carpenters and the Institute for Construction Economic Research. Workers are denied at least \$811 million annually in FLSA-mandated overtime pay. Employers shift at least $3 billion in annual Social Security and Medicare taxes onto their workers’ paychecks.
The shift to independent contracting was only the beginning. Today, nonunion construction is largely an underground cash economy defined by day labor and wage theft. In many regions, the informal sector is now organized through labor “brokers” who recruit workers from their long lists of personal contacts, often undocumented and paid under the table.6(<)meta charset='utf-8'(>)Around 20 percent of construction projects today are still unionized. According to median weekly wage data from the Current Population Survey, union construction workers earned 36 percent more than non-union members in 2020. For a sense of regional diffusion, consider that a carpenter in nonunion Houston earns 46 percent less per hour than a carpenter in union Los Angeles. Verbal agreements on wage rates with undocumented workers are regularly violated. “We’re in a country where our immigration policy is in direct conflict with our labor protections,” says Cal Soto, Director of Workers’ Rights at the National Day Labor Organizing Network (NDLON). “Employers can take advantage of the fact that one worker can be paid less because that worker is afraid of retaliation from immigration enforcement, or they’re afraid that they don’t actually have the same protections under the law, because of their [immigration] status.”
By nature, the incidence of such payroll fraud and wage theft in a quasi-underground labor market are impossible to measure accurately. A 2008 survey of over four thousand low-wage workers across the country found that two in three had experienced wage theft—payment below the minimum wage, for example, or nonpayment of overtime—in the previous week. A 2010 survey of 1,800 low-wage workers in Los Angeles (earning less than $11.90 an hour in 2006 dollars), of which half were unauthorized immigrant workers, found 88 percent of respondents had experienced a pay violation (most commonly, sub-minimum wage pay) in the previous week. Conservative estimates find that payroll fraud affects between 12 and 20 percent of the industry workforce nationally, or between 1.30 and 2.16 million workers.
Eventually, even employers sensed something was wrong. In 1992, Ted C. Kennedy, a merit-shop advocate and former ABC president, warned an industry gathering that “As long as contractors continue to treat their employees as seasonal harvest hands instead of skilled professionals, we cannot expect to maintain a workforce of skilled 20-year veterans.”7(<)meta charset='utf-8'(>)Linder, (<)em(>)Wars of Attrition(<)/em(>), 391-2.
Recognizing the problem was easier than remedying it. At root is the industry’s decentralized and geographically fragmented structure. Unlike other industries (like retail or tech) where employers have defeated new organizing campaigns, building contractors are often small and unable to develop nonunion alternatives for training new workers. Many contractors are unwilling or unable to internalize training costs in elaborate HR bureaucracies in companies promising upward mobility. Neither have they been able to get government to foot the bill. White-collar employers benefit from federally-guaranteed student debt, which provides them with the free gift of an educated labor force. But builders have failed to win vocational education subsidies on a comparable scale.
It would take a powerful labor movement to compel employers to finance training or allow unions to manage training and hiring. But in a competitive, decentralized industry, worker power threatens individual firms. Wage determination and skill requirements are thus inseparable, but not in the way most labor economists argue. “Human capital” explanations for inequality in recent decades have drawn attention to labor allocation—to the matching of skills and jobs. The solution has been to focus on skills “upgrading” and access to college degrees. But it is control over credential requirements—rather than the credential itself—that empowers the parties to a wage bargain. As economists such as Alicia Sasser Modestino, Aaron Sojourner, and Claudia Macaluso have shown, employers can simply increase the amount of education required—“upskilling”—for given types of employment.
Within construction, where access to any kind of training has collapsed with the rollback of union power, employers have been left to lobby for the expansion of vocational education—shifting training costs onto the federal and local governments. Given the larger disconnect between market wages and credentials, there is no reason to expect vocational education to raise wages unless it is a step to collective bargaining. It is influence over the price of skills, and not skills alone, that determines wages in the labor market.
The Shutdown and its Sequels
UCLA economist Edward Leamer argued in 2007 that “Housing is the business cycle.” But during the unusual Covid-19 recession, building defied the business cycle. With the designation of construction as an “essential service” in many states, the continuation of residential and warehousing construction through the shutdowns marked out a rare arena of economic dynamism. “We are in the midst of one of the longest construction booms in my memory,” Erlich told me in May. It is “as if the pandemic hadn’t happened.”
Private residential and commercial construction are major barometers of capitalism’s health that today issue widely divergent readings. Commercial property values have fallen across the nation during the pandemic, as tenants renegotiate leases for office and retail space. Despite the industry’s buoyancy during the shutdown, industry spokesmen claim that the need for public spending to stimulate the industry is dire. “This is clearly going to be a difficult year for the construction industry,” Stephen E. Sandherr, CEO of the AGC, said in March 2021. “Demand looks likely to continue shrinking, projects are getting delayed or canceled, productivity is declining, and few firms plan to expand their headcount.”
At the same time, residential building is booming. As potential home sellers postponed moves during the pandemic, sales inventory remained at a cyclical low. Many of the sales of 2020 never occurred, and active listings, which peaked at 1.3 million monthly in the summer of 2019, fell this spring to around 490,000. With supply restrained and demand fueled by historically low borrowing costs, the price of homes has skyrocketed. High sales prices and easy financing, in turn, has led to a boom in private housing starts, which in January surpassed its pre-pandemic peak of 1.6 million units. Likewise, the growth of e-commerce and logistics during the pandemic spurred a parallel boom in warehousing space, while the same trends that are dragging down commercial real estate valuations create new construction projects to convert existing properties. As CBRE, the nation’s leading real estate firm, reports, a “new trend has emerged: the conversion of underperforming or obsolete retail sites into warehouse/distribution facilities.” The National Association of Realtors’ first quarterly survey for 2021, for example, found 39 percent of commercial members’ reported construction projects for converting vacant malls into mixed-use projects.
The fractured economic landscape is matched by political confusion. Historically, the growth of the nonunion, independent-contracting, and quasi-legal construction economy has left the industry in an awkward position. The anti-union ABC endorses conservative Republicans who campaign on reducing undocumented immigration—even as their members make up the portion of the construction market most dependent on unauthorized workers for cheap labor. While the ABC supports “a flexible visa system that allows sufficient access to permanent and temporary foreign workers,” it is also “concerned” that legislation to create a pathway to citizenship for the 11 million undocumented immigrants in the US “largely ignores the drivers of illegal immigration and the enforcement needed to prevent the circumvention of our nation’s borders and immigration laws over the coming years.”
During the Obama administration, the ABC sued every regulatory change the Department of Labor promulgated to constrain the use of independent contracting and raise employment standards. It opposed executive orders to raise the minimum wage for federal contractors, and won an injunction against the administration’s “Fair Play and Safe Workplaces” executive order mandating all federal contractors disclose past complaints for violations of labor and employment law. Together with the AGC, it opposes federal funding for jointly administered apprenticeship programs, prevailing wage laws, and any tightening of the rules on the use of independent contracting. This shamefaced reliance on the apartheid-like interaction of US labor and immigration law, with a simultaneous plea for public subsidy for unilateral employer training, was embodied by Donald Trump, a real estate developer who campaigned on infrastructure spending and whose personal use of undocumented labor did not stand in the way of his anti-immigrant political platform.
In 2020, the national ABC endorsed Donald Trump for re-election (the AGC declined to take sides). During the campaign, Michael D. Bellaman, President and CEO of ABC, and Tim Keating, ABC 2020 National Chair, wrote to Trump praising his “promise to veto the Protecting the Right to Organize (PRO) Act,” a proposed labor law reform which would make it easier for workers to unionize. The ABC hailed President Trump’s stance as an assurance that the administration “will protect the merit shop construction industry and small businesses, which are the backbone of our economy.” Though many of the AGC’s members engage in collective bargaining, the geographically fractured marketplace has left the unions unable to shift them toward supporting laws to eliminate the competitive edge of the nonunion firms: the AGC, like the ABC, is against the PRO Act and federal funds for jointly administered apprenticeships. But the employers have also found elements of the Biden administration congenial. Both the AGC and the ABC call for more infrastructure money, while they vigorously denounce tying the funds to the administration’s broader professed labor agenda.
Can the Biden administration, which supports passage of the PRO Act, enfranchise the underground army of construction workers and bring order to the wild-west dealmaking of subcontractors and labor brokers? As with much of the liberal program, this will depend on whether congressional Democrats can overcome obstacles like the Senate filibuster. Democratic Party leaders in both the House and Senate have proposed including immigration reform in the next continuing resolution on budget reconciliation, packaging it with the infrastructure program (which itself contains provisions bearing on union employment on federally-funded projects).
One sign of the administration’s seriousness was the appointment in January of Marty Walsh, former president of the Boston Building Trades Council, as Secretary of Labor. In February, the administration appointed Julie Su as Deputy Labor Secretary. As director of the California Division of Labor Standards Enforcement, Su has been responsible for much of the data and increased enforcement against wage theft and payroll fraud in that state over the past decade. More recently, Walsh invited David Weil, who pioneered the study of wage determination in independent contracting, to reprise his late-Obama era role as Administrator of the Wage and Hour Division.
But labor law and regulatory reform has powerful enemies in an economy whose growth sectors are marked by the pervasive use of independent contractors. With an ally of organized labor in the White House, the ABC has reprised this role as attack dog for the broader anti-union movement in the US. In January, the Trump Labor Department issued a rule excluding many contractors from the Fair Labor Standards Act—a final regulatory bid to protect the sprawling independent-contractor economy. When Walsh reversed the rule, the ABC’s Southeast Texas Chapter spearheaded a lawsuit against the new Labor Secretary. Together with the Coalition for Workforce Innovation (CWI), a lobby founded by the Retail Industry Leaders Association and backed by such app-based employers as Uber and Postmates, the ABC hired the anti-union firm Littler Mendelson to file a federal complaint in the Eastern District of Texas. An interest in blocking reform draws together such apparently different actors as Silicon Valley and nonunion construction. The coalition to protect independent contractors is growing, with over thirty industry associations from America’s Newspapers and the American Trucking Association to the financial services and multi-level marketing industries backing the CWI.
Can a balance of power be found between the beleaguered construction unions and the anarchic, highly competitive, and pervasively fraudulent industry of building contractors? Since the 1970s, an unregulated, underground, and cash-based labor market has grown up across the US to provide contractors and construction users with a solution to the problem of high labor costs. In the form of the “sharing economy,” a sleeker, legally sanctioned version of the construction labor market model now structures the working lives of millions across the service sector, from transportation and retail to education and healthcare. Some hint of workers’ future in these other sectors will be found in the fate of organized labor within its historic stronghold, construction.
In circumventing the sources of worker power—construction unions—employers also destroyed the institutions that had historically been responsible for training skilled workers. In responding to one labor shortage, they wrote the script for another, and now find themselves unable to offer a coherent private option for investing in the workforce of the future.8(<)meta charset='utf-8'(>)A similar case can be seen in the trucking industry, which like construction was fundamentally restructured along nonunion lines after the 1970s. Persistent employer claims of a “truck driver shortage” prove, on closer examination, to be better explained by the fact that “truck drivers aren’t being paid enough or treated well enough by their employers.”It may be that the current experience of scarcity will offer an opportunity for progress: not for the first time, liberals are presenting their reformist economic programs as supply-side solutions to market shortages. But any such effort will run aground unless it recognizes that the “skills gap” is not a technocratic question but one whose solution will require the reordering of labor-market institutions and the power relations underlying them.
During the first era of globalization (1870–1913), the global division of labor was stark. Britain and other Western nations largely produced manufactured goods, but they also exported a whole range of temperate agricultural goods like wheat, beef and barley. Elsewhere in the European colonial empires, products like cotton, cocoa and coffee were exported, often at very low prices and sometimes with forced labor, to sate a growing demand in the global economic core for tropical luxuries. More than a century has passed since World War I heralded the collapse of this world order. Today, the globalization wave that has shaped the world since the 1980s is ebbing.
What is the legacy of the First Globalization of the late nineteenth- and early twentieth-centuries on the economic fortunes of countries during the Second Globalization? To what extent have countries’ positions in the international economic order been persistent across the two globalizations, with some trapped at the bottom and others comfortably on top?
Long-term development trajectories are commonly explained through the convergence hypothesis. Derived from neoclassical growth theory, it states that “initial conditions have no implications for the long-run distribution of per capita income.” The hypothesis suggests that history has no persistent bearing on countries’ relative wealth: if left to the laws of the market, poorer countries are expected to catch up by outperforming richer countries in their rates of economic growth. However, the convergence hypothesis is not backed by empirical evidence—extensive testing has not heralded the results that standard growth theory would expect. In an effort to elucidate these findings, a quickly growing “persistence literature” has proposed a range of explanations for why countries’ relative wealth today is historically rooted in institutional quality (referring in this case to property rights regimes and liberal representative democracy), culture, religion, geography, or even genetics. Crucially, the persistence literature seeks to explain the lack of convergence while leaving the neoclassical growth theory which underpins it untouched.
In contrast to these extra-economic explanations, new research that I have co-authored with Gregor Semieniuk, Tom Westland, and Junshang Liang, investigates how countries’ productive capabilities themselves are path dependent. Our research builds on the economic complexity literature and the longstanding insight of development economics that what countries export matters for their prosperity. We understand “productive” in analogy with the notion of productive labor in classical political economy: not in a normative or moral sense, but as production activities validated in market exchange. To be more precise, since we are interested in countries’ relative positions in the global economy, our reference point is validation in the world market. The more productive capabilities a country has, the more things it can produce competitively and hence the more diverse its exports. At the same time, the more productive capabilities a country has to begin with, the more productive capabilities it can develop. Put simply, productive capabilities breed productive capabilities. For example, a country which already has a competitive computer chip, car and smartphone industry is more likely to have firms that develop smart cars than a country that is only exporting agricultural goods.
Understanding the path-dependence of productive capabilities is crucial because it suggests that the ways in which countries were integrated into the global division of labor in the previous globalization has a bearing on their present and future growth. Rather than catching up to high-value exporters, countries that started off as raw material exporters are likely to maintain low productive capabilities in the long run. On the other hand, early industrializers are expected to remain at the top of the global productive capabilities hierarchy. Of course, the productive capabilities distribution in this era is not a result of the free play of the market. The patterns of export identified by this framework reflect the structures and interests of empires, and thus allow us to integrate the historical trajectories of empire into our study of economic development.
To test the long-term persistence in productive capabilities, we have assembled a large new database of global commodity exports from 1897–1906. We exploit the fact that this period was the high point of colonial trade statistics and use a large variety of primary sources across five languages. To the best of our knowledge, ours is the most ambitious census of world exports for the previous globalization to date. This allows us to investigate the long-term wealth of nations in ways that aren’t possible with GDP data. The latter is sparse and unreliable for large parts of the world before the Second World War. We use export diversification, economic complexity, and export sophistication, as well as the manufacturing share of exports as key indicators of countries’ position on the global productive capabilities ladder. We have converted our historical data into the Standard International Trade Classification. This allows us to measure these indicators in a consistent fashion across a century.
In Figure 1, we map global export diversification across the two globalizations. It clearly suggests persistence. The continued dominance of Europe and North America after decades of deindustrialization catches the eye. China and India are still surprisingly diversified at the turn of the twentieth century, despite a long period of decline in native industries at this point. From the vantage point of our comparison, the recent rise of Asia appears as a re-emergence for some key countries. Africa is largely trapped at the bottom of the diversification hierarchy and several countries are ranking even lower today than at the time of direct colonial domination. There are some hopeful cases of catching up in Latin America. Eastern European and Middle Eastern countries have mostly fallen behind.
In Figure 2, we plot economic complexity—a measure that combines information about the diversification of economies and the ubiquity of commodities in exports—across the two globalizations. This measure, too, leaves little doubt about persistence in productive capabilities: the higher a country’s economic complexity a century ago, the higher it is today. We find the same strong and positive relation for our other proxies of productive capabilities. Our econometric analysis confirms that the great impact of history on today’s productive capabilities is statistically significant, quantitatively large and robust to controlling for variables usually considered as important drivers of growth and export diversification such as economic liberalization, human capital, and the quality of institutions. We also demonstrate that our results are not driven by persistence in geography or institutions.
Not only is the hierarchy in productive capabilities highly persistent, but countries’ export baskets under the previous globalization predict more than half of the variance of today’s real GDP per capita. What you exported in the past matters for where you are on the development ladder today. This is the case not because of cultural traits, geographic conditions, or genetics, but as a result of the ways that countries have been integrated into the global division of labor in the first place and how the forces of competitiveness have reproduced the same hierarchy of global productive capability. Yet, if colonial status correlated highly with productive capabilities at the turn of the twentieth century, countries that were European overseas colonies had fallen even further behind by the turn of the twenty-first century. The long shadow of colonization cannot be captured simply by the path dependence in productive capabilities. It needs to be theorized in its own right. Refocusing the explanation of long-term differences in development to economic factors and a cumulative dynamic is a first, preliminary step in that direction.
Comments Off on Repressing Labor, Empowering China
Though the lockdown in 2020 threw many workers out of work, the big fiscal stimulus, fueled by government debt and an unprecedentedly large monetary expansion, offered stimulus checks and elevated unemployment benefits to millions of Americans. In 2020, US federal spending grew by 50 percent, making the deficit share of GDP the largest since 1945, and the M2 in the economy grew by 26 percent—the largest annual increase since 1943. Such fiscal and monetary expansion prevented a collapse in consumption. After an initial fall in Spring 2020, US household consumption bounced back and grew by more than 40 percent in the third quarter.
The Amazon syndrome
The boost in consumption made online retail merchants among the biggest beneficiaries of the fiscal and monetary stimulus. Amazon, one of the largest and most profitable companies in the world, saw its profits surge during the pandemic. Revenues and net profits growth for Amazon were 38 and 84 percent respectively for 2020. Simultaneously, Amazon workers got an average pay raise of only 6 percent, including bonuses and extra hazard pay. This disparity indexes exactly how the benefits of the monetary and fiscal expansion are distributed between capital and labor. Given the defeats of unionization drives in Amazon warehouses, we can expect this disparity to persist or get worse.
Amazon’s business is not just a question of capital and labor, but also of international political economy. Measured in gross merchandise value, 40 percent of sales in Amazon are directly from Chinese vendors. During the pandemic of 2020, 75 percent of new sellers on Amazon were from China. Amazon has aggressively recruited Chinese vendors to sell items to its customers directly, despite the concern that this practice elevated the percentage of mislabeled, faked, and unsafe products sold on the platform.
It is not an accident that amidst the pandemic, the US trade deficit in general and the deficit with China reached a historic high, trade war notwithstanding. Amazon is not the only retailer that expanded its sourcing from China during the pandemic. Chinese electrical appliance exporters saw a surge in orders from the US and elsewhere that they could barely manage. As such, a large part of the stimulus-fueled consumption spending in 2020 went to purchase goods from China. This is only an acceleration of a trend that began long before the pandemic. Before Amazon, Walmart exemplified the same dynamic, in which the liquidity provided by the US state supports consumption spending, which largely benefits US corporations and China’s export machine, rather than US workers.
In light of these dynamics, the recent discussion about whether the great fiscal and monetary expansion will bring back high inflation is misplaced. The dominance of monetarism as an economic doctrine has long gone, as we are told. But curiously, many public intellectuals and policymakers are still stuck in the monetarist assumption that fiscal spending and money supply growth will bring out-of-control inflation. We are still haunted by Milton Friedman’s assertion that “[i]nflation is always and everywhere a monetary phenomenon in the sense that it is and can be produced only by a more rapid increase in the quantity of money than in output.” Echoes of Friedman can be heard when Larry Summers criticizes Biden’s \$1.9 trillion stimulus plan for being “the least responsible economic policy in the last forty years,” arguing that it would only ignite inflation “of a kind we have not seen in a generation.” But there is no reason to believe that Summers’ warnings will age better than the 2004 Economist cover with a platform shoe and a “Back to the 1970s” headline or Niall Ferguson’s 2011 prediction of a double-digit “Great Inflation of the 2010s.”
Facing the mismatch between economic reality and monetarist orthodoxy, we should not blame the reality, but question orthodoxy. In 2017, then-US Fed Chair Janet Yellen admitted that she and her colleagues “may have misjudged….the fundamental forces driving inflation” after spending two days in the Fed policy meeting to debate the “mystery” of low inflation amidst abundant money supply. When central bankers from around the world met at the IMF Annual Meeting in DC in 2017, the paradox of stubbornly low inflation amidst large government deficit and cheap money across the developed world were enthusiastically discussed. The World Economic Outlook that the Fund published on the eve of the Meeting pointed out that “persistently low inflation in advanced economies… deepens the downside risks to advanced economies’ medium-term growth prospects,” presenting a major risk to the global economy. Echoing Yellen, IMF research director Maurice Obstfeld added at the report’s release press conference that such low inflation is “puzzling.”
The labor theory of inflation
We do not need to look far for a theory that can better explain the “puzzling” absence of inflation in recent years. In the 1960s and 1970s, before the rise of monetarist orthodoxy, many social scientists agreed on a labor theory of inflation, according to which the most important cause of inflation was the rising wage demands of powerful unions. This view was shared by Marxists like Robert Rowthorn and Weberians like John Goldthorpe, as well as centrists and conservatives. As laid out in a 1970 OECD report, high inflation in rich countries was understood to be a problem of the “wage-price spiral.” The concentrated power of workers organized into unions meant they could demand higher wages, which businesses would then attempt to recover by passing on higher costs to consumers. Ever rising consumer prices would lead workers to demand ever higher wages, and so on, in an unhappy cycle of rising prices. To remedy inflationary pressure, an earlier study by the US Chamber of Commerce suggested that “union monopoly… [and] compulsory unionism”—in other words, the basic framework of post-New Deal labor relations—“must be eliminated.”
In 1970, Barry Goldwater, the father of the American New Right, declared that “higher and higher union wage hikes” was the “root cause of the present price inflation.” He even suggested Friedman’s monetarist theory of inflation was a liberal apology for organized labor, downplaying “the tremendous role played by union demands in increasing the cost of production and causing the upward spiral of prices.”
What became of this labor theory of inflation, once so prevalent on both the left and the right? In large part, it has been overshadowed by Friedman’s monetarist explanation. In October 1979, Fed Chair Paul Volcker announced his conversion to monetarism. In practice, this meant the Fed would fight inflation by limiting the growth of the money supply (rather than targeting interest rates). The Fed’s evident success in stemming inflation by the early 1980s appeared to confirm the power of the monetarist approach. But historical research has revealed that the Fed’s embrace of monetarism was as much political as analytical.
In a 2016 paper, Daniel Thompson and I performed a test of the labor and monetarist explanations of inflation. Using data from twenty-three OECD countries from 1960–2009, we found that the power of labor—measured by labor share of GDP, unemployment rate, or union density—exerted a much stronger influence on the inflation rate than did the rate of growth of the money supply. Even a casual look at the curves of changing inflation rates of most OECD countries over the period reveals that they coincide much better with changes in labor power than with changes in the money supply. This would not have surprised Volcker himself. Even as Fed officials addressed the public in technical, monetarist terms, they were privately obsessed with the role of industrial relations and collective bargaining in fueling inflation. Monetary tightening was a means to induce recession and force the unions to restrain their wage demands.
Monetary contraction was only one of the tools the Reagan administration leveraged to beat back organized labor. In 1981, Reagan used the brute force of the state to crack down on unions by firing 11,000 striking air traffic controllers, jailing their leaders, and decertifying their union. Tellingly, Volcker called defeating PATCO, the air traffic controllers union, “the most important single action of the administration in helping the anti-inflation fight.” The success of this assault on labor can be read in the statistics. Union density fell from a peak of 33 percent in the 1950s to barely 10 percent now. The decline of unions and increasing competition from low-wage countries did bring down wage growth and, with it, inflation. Under the great wage repression, workers’ hourly compensation grew by only 11.6 percent from 1979–2018, while productivity grew by 69.6 percent over the same period. This was a sharp contrast to 1948–79, an era of stronger unions, when compensation grew by 93.2 percent, nearly tracking productivity growth of 108.1 percent.
Why has the monetarist theory endured, despite the evidence against it? Friedman’s theory sanitizes and depoliticizes the act of dismantling union power, casting it as a technocratic adjustment by central bankers committed to price stabilization. Long after it fell out of fashion in academic economics, monetarist orthodoxy remains attractive as a rhetorical device on the right today.
Cheap money flows to Wall Street and China
Recovering the labor explanation of inflation allows us to resolve the so-called mystery of chronic low inflation despite great fiscal and monetary expansion from 2001–2019. It also provides an insight into the fateful interdependence of American and Chinese economic processes. With workers’ bargaining power curbed, monetary expansion could no longer contribute to any wage-price spiral, even with low unemployment. While cheap money does not bring wage growth today, it does flow into financial markets, where it inflates asset bubbles and boosts debt-fueled consumption. The assault on US labor was simultaneous with the global expansion of productive capacity in low-wage countries, notably China. At the same time, consumption in the US has been maintained through the expansion of personal debt and cheap imports. When China joined the World Trade Organization in 2001, it became in large measure the workshop of the world. With an army of disciplined and low-cost, rural-originated labor not protected by independent unions, Chinese factories pumped out a whole range of consumer goods at a fraction of the US cost. For American workers, the price of this import bonanza was the loss) of 2–3.7 million manufacturing jobs between 2001 and 2018.
The interlock between Chinese production and American debt-fueled consumption can also be seen as a set of financial flows. Much of the cheap money created by the Fed flowed into China’s foreign exchange reserves, denominated mostly in USD. These ballooning foreign exchange reserves allow the People’s Bank of China, China’s central bank, to create commensurate new liquidity in RMB, China’s currency, to boost domestic economic growth. As in the US, this new liquidity aggravated preexisting sectoral imbalances and inequality between capital and labor. Most of the liquidity ends up fueling investment by local governments and state enterprises, which have privileged and unlimited access to cheap loans from state banks. Workers and peasants benefit the least. As a result, the growth of per capita disposable household income and per capita household consumption expenditure has fallen far short of the growth of GDP per capita throughout the China boom. As of 2018, China’s GDP per capita is 64,644 RMB, more than two times of disposable household income per capita of 28,228 RMB. Corporate profit and government income account for the gap between the two figures.
One consequence of such imbalance and inequality, aggravated by the surge in global USD supply, is the relatively slow growth of household consumption and the buildup of industrial overcapacity. China responds to this challenge by exporting its excess capacity overseas, a policy accelerated by the Belt and Road Initiative begun in 2013. Beijing has been channeling a large part of its foreign exchange reserves toward the developing world in the form of development loans, largely denominated in USD. The terms of the loans are obscure, but research finds that nearly 90 percent of contractors in Belt and Road projects are Chinese. With pushback against Chinese lending in many recipient countries and the concern about the viability of many of the Belt and Road projects, China’s capital export saw a retreat after 2016. But as indebtedness and overcapacity resurged after Beijing doubled down in its monetary stimulus to rescue the economy from the pandemic fallout, it is well plausible that China’s capital exports will regain momentum in the years to come.
For US corporations active in emerging markets, China’s capital exports represent intense competitive pressures. In the 1990s and 2000s, US transnational corporations, motivated by their real or expected interests in expansion in China, served as Beijing’s proxy lobbyists in Washington. They worked hard to ensure a friendly US-China policy and obstructed any hostile policies. Today, many US corporations still benefit from their dealings with China, but an increasing number now see their Chinese counterparts as rivals in the world market. The intensifying competition from state-supported Chinese enterprises in more recent years dampens US corporate enthusiasm in neutralizing any Washington action that irks Beijing.
Inter-imperial rivalry and its remedy
Since the 1980s, easy money, combined with the epochal disempowerment of labor, has brought financial bubbles and domestic inequality. It has also aggravated geopolitical tensions. Development loans and capital exports from China have allowed Beijing to expand its sphere of influence in the developing world at the expense of Washington. This largesse has swung erstwhile US allies to Beijing’s position on contentious geopolitical issues and offered a lifeline to internationally sanctioned regimes like Iran and Russia. As such, a bloc of authoritarian rivals to the US has become ever stronger on the world stage. The resulting intensification of the great powers rivalry is comparable to the inter-imperial rivalry at the turn of the twentieth century unleashed by the rise of the German Empire, a relatively late-developing capitalist power whose loans and investments to underdeveloped regions of the world brought it into competition with established powers like Britain and France. As in contemporary China, Wilhelmine Germany was marked by deep domestic distributional conflict, as evidenced by the rapid growth of the German Social Democratic Party (SPD). And in 1914, as today, rising global tensions co-existed with a seductive belief that economic interdependence had made major war impossible.
Well before the pandemic brought on a protracted global recession, central banks worldwide worried that low inflation was stifling growth and dampening investment. They were rightfully looking for ways to reflate the economy in the aftermath of the global financial crisis and the years of anemic recovery that followed. But even as central bankers began to rethink the virtues of inflation, they did not grasp the root of the problem: the great disempowerment of labor since the 1980s. On the eve of the pandemic, the wage and salary share of US GDP had dropped to a historic low (just over 40 percent in 2019). Democrats in Washington are now floating plans to strengthen US labor by reshoring key US manufacturing, re-building US infrastructure, offering support to unionization, and pursuing a worker-centered trade policy that puts labor and wage standards into trade agreements. If successful, a healthy growth of wage and price could lead to a more sustainable economic expansion without requiring incessant monetary growth. The end of cheap money will not only tame financial bubbles and reduce inequality, but also help reduce international tension worsened by the excessive global supply of the USD.
The Democrats’ initiatives to re-empower labor are commendable. But there is no indication that the defeats of the 1980s will be reversed easily. The defeat of organized labor in the Amazon warehouse, along with the defeat of efforts to raise the federal minimum wage, reminds us that labor’s position has been further weakened by the heightened precarity of lockdowns and massive layoffs. Despite recent scares about the return of inflation, any price increases so far seem to be temporary and related to specific bottlenecks, rather than a general shift in class power. Even if such a shift were in the cards, the political consequences of a new surge of worker power remain deeply uncertain. As a recent study shows, to re-empower labor and push the inflation rate up to a healthy level, the Biden administration would need to let money wage grow faster than productivity and price growth for a sustained period. This would certainly provoke interest rate hike and financial asset deflation, which would trigger strong political resistance from Wall Street and affluent households.
In China, domestic redistribution would go a long way to reducing global tensions. A redistributive reform corresponding to an American “new New Deal” could increase wages and household consumption growth relative to capital accumulation. This would tame China’s urge to export capital and arrest the impending collision between late imperialism and established empires. But the power monopoly of the party-state capitalist elite makes redistributive reform in China no easier to achieve than it is in the US. Until the difficult rebalancing and reforms on both sides of the Pacific gain traction, the world will continue to be on the dangerous path of inter-imperial antagonism resembling the international politics of a century ago. Renewing the world economy without a clash between great powers is going to be an uphill battle.
In her first statement as Treasury Secretary, Janet Yellen said that the United States faced “an economic crisis that has been building for fifty years.” The formulation is intriguing but enigmatic. The last half century is piled so high with economic wreckage that it is not obvious how to name the long crisis, much less how to pull the fragments together into a narrative. One place to start is with the distribution of national income between labor and capital (or, looked at another way, between the wage share and the profit share of national income).1The basic idea of a labor share of income is simple, but several issues should be briefly noted. First, there are alternative ways to construct the series: the numerator might include all forms of compensation (including benefits and bonuses) or just wages and salaries; the denominator might be national income, nonfarm business income, gross value added, an so on. Different choices here may imply different turning points, but none alters the overall trend. Second, most measures of labor income includes income earned by the very wealthy (for example, executive salaries or bonuses). This means the labor share meaningfully (<)em(>)overstates(<)/em(>) the income received by non-supervisory workers. Finally, in addition to secular trends, income shares display a cyclical pattern: over the course of an economic expansion, the wage share will generally fall and then rise, while the profit share will rise and then fall. This reflects a number of factors, only some of which can be interpreted as expressions of relative class power. While this makes the statistic a potentially poor guide to short-run developments, at the timescale considered in this essay the secular decline in the labor share clearly dominates any cyclical variation. About fifty years ago, the share of income going to labor began to decline, forming a statistical record of the epochal collapse of working class power. Episodes of high employment in the 1990s and the late 2010s did not reverse the long-term pattern. Even today, with a combination of easy money and fiscal stimulus unprecedented since World War II, it is unclear what it would take to reverse the trend in distribution.
Few would seriously dispute that hawkish Federal Reserve policies have played a direct role in the decline of the labor share since the 1970s. This is the starting point for thinking about monetary policy and the income distribution, but many questions remain. Today’s expansionary program extends beyond monetary policy to include fiscal stimulus and even industrial policy, but the first sign of an elite rethinking was the Fed’s dovish turn around 2016. (The Fed chair then was Yellen, whose current tenure as Treasury Secretary has been marked by close coordination with her successor, Jerome Powell.) In a fundamental sense, the entire Biden program hangs on the Fed: low interest rates made possible a reevaluation of the cost of massive government debt, which has in turn opened new horizons for a would-be activist government.
If the age of inequality was the product of a hawkish Fed, could a dovish central bank reverse the damage? Today, there is more reason to speak of a “pro-labor turn” than perhaps at any time over the last half century. But history is not so easily reversed. The new policy regime is not a simple course correction to decades of misguided neoliberalism. There is evidence that the current experiment was made possible by a recognition that workers had suffered a secular defeat—specifically, that they had lost the ability to increase or even defend their share of the national income. What would happen if labor became stronger?
The distributional shift
For decades, decisionmakers at the Fed have carefully monitored labor relations. The attention has often resulted in contractionary monetary policy aimed at restraining ostensibly inflationary wage demands, particularly those made by major unions during collective bargaining. Such was the case with the recession of 1970–1971, which put an abrupt end to an extended period of tight labor markets that had resulted in a marked increase in the wage share. As Alfred Hayes, president of the New York Fed, told his colleagues on the Fed’s Open Market Committee (FOMC):
The outlook for major [contract] negotiations in 1970 is disturbing… some moderate rise in unemployment is a necessary condition to checking the inflationary spiral. This is another way of saying “The slowdown is what we have been trying desperately to achieve. Let’s not reverse it before it has had some results.2Quotes in Edwin Dickens, “(<)a href='https://journals.sagepub.com/doi/10.1177/048661349602800310' target='_blank' rel='noreferrer noopener'(>)The Federal Reserve’s Low Interest Rate Policy of 1970-72: Determinants and Constraints.(<)/a(>)” (<)em(>)Review of Radical Political Economic(<)/em(>)s (1996).
In the story economists tell about the 1970s, the Fed recklessly ignored the need for monetary rigor because discipline was unpopular with politicians and voters. But in reality, hawkish views like Hayes’s guided policy throughout the decade. A glance at the data shows that aggressive rate hikes were underway throughout 1973 and continued for months during the deep mid-decade recession.
The rigor reached new heights with the ascent of Paul Volcker to Fed chair in late 1979. Volcker saw wage demands as a central cause of rising prices and hailed Reagan, with his anti-union interventions, as an exceptionally effective complement to tight money. He even carried an index card schedule of upcoming union contract negotiations in his pocket. Despite occasional tensions, the Volcker-Reagan two-step got both men what they wanted. Along with inflation, union density and strike activity plummeted. The decline was led by the goods-producing sectors, where unions were either broken or forced into concessions. And when productivity growth resumed, wages remained far behind.3(<)meta charset='utf-8'(>)Tali Kristal, “(<)a href='https://www.jstor.org/stable/23469217?refreqid=excelsior%3A5894bac57300efd3a39d330aa3c0b5ae&seq=1#metadata_info_tab_contents'(>)The Capitalist Machine: Computerization, Workers’ Power, and the Decline in Labor’s Share within US Industries(<)/a(>),” (<)em(>)American Sociological Review(<)/em(>) (2013).
As wages fell behind productivity, a shift of income away from wages was inevitable. Was it intended? Volcker would have said that defeating inflation was necessary for any future economic progress, including wage growth. If inflation destroyed the value of the dollar, a union paycheck wouldn’t be worth the paper it was printed on. He might also point out that recessions squeeze profits as well as wages. Volcker was genuinely independent from narrowly defined special interests, as evidenced by his conflict with the finance-captured core of the Obama administration. And there have been episodes—most notably, the late 1990s—when wages have been allowed to grow. There is no reason to doubt that policymakers sincerely welcome wage growth as long as they believe it poses no threat of inflation.
But it does not take much for central bankers to conclude that wage growth poses a threat of inflation. This tendency reflects political commitments. (Even if one accepts the picture of a wage-price spiral, why emphasize union wage demands, rather than corporate pricing policy, as the cause of that spiral?) In theory, the state could have attacked the 1970s inflation in other ways: mandatory price controls on key inputs, public investment to relieve bottlenecks, nationalization of the noncompetitive and state-dependent oil and defense sectors. Initiatives like these, not infrequent in the history of modern capitalism, were commonsensical to many New Dealers. But in the 1970s, no coalition emerged to remake the concentrated, private core of American economic life. This absence left shock treatment as the only option.4(<)meta charset='utf-8'(>)More radical alternatives received serious discussion in center-left circles at the time, suggesting that the failure was not primarily one of imagination. For example, a 1985 Brookings Institution volume could conclude that “the chapters in this book suggest that the problem of inflation is never resolved without tackling the broadest questions of political control of the economy.” The editors went on to recommend no less than the socialization of investment: “The alternatives of economic policy—how much investment, what sort of investment, what provisions for disinvestment—need to be placed before elected representatives.” Charles S. Maier and Leon N. Lindberg, “Alternatives for Future Crises,” in Lindberg and Maier, editors, (<)em(>)The Politics of Inflation and Economic Stagnation(<)/em(>) (Washington DC: Brookings, 1985).When the downturn came, both banks and unions counted among the casualties. But neither the recession nor the recovery was evenhanded. Homeowners and international banks were sheltered from the worst effects of tight money. Growth, once it resumed, was also invidious. From 1981 to 1996, the Dow Jones more than quintupled; real wages in 1996 were lower than they had been since the Gulf of Tonkin.
No one could have predicted all of this. But redistribution was part of the plan. As Fed chair Arthur Burns reminded an audience in 1977, “ours is still predominantly a profit-motivated economy in which, to a very large extent, whatever happens—or doesn’t happen—depends on perceived profit opportunities.” At the very least, the profit share had to be protected from further erosion. Volcker (and many others) went further, declaring the need to reduce “unit labor costs”—a technical term for the ratio of labor compensation to output.5(<)meta charset='utf-8'(>)At the aggregate level, therefore, real unit labor cost is just another way of expressing the labor share of income. Depending on your persuasion, see Marc Linder, “(<)a href='https://ir.uiowa.edu/books/4/'(>)From Surplus Value to Unit Labor Costs: The Bourgeoisification of a Communist Conspiracy(<)/a(>)” (1994) It was not just on the shopfloor that labor threatened profits. US inflation weakened confidence in the dollar, threatening the value of dollar-denominated assets and the profits that US bankers derived from dealing in the world’s reserve currency. It was Chase Manhattan’s David Rockefeller who recommended that Carter appoint Volcker, a longtime Chase employee. Rockefeller himself had been offered the Fed post, but turned it down because a “wealthy Republican with a well-known name, and a banker to boot” was the wrong man to implement what he already knew would be “a set of draconian policies.” Better that the job should fall to Volcker, a Democrat unknown to the man on the street (even Carter had never heard of him) but well known to financiers in New York, Zurich, and Riyadh.
Writers sometimes refer to a “Volcker coup.” But the Chairman’s ability to reorient the world economy was possible because it was accepted as legitimate and necessary by a substantial bloc, including the leaders of both US political parties and central bankers around the world. Calls for tight money had always been heard in financial circles, but by the late 1970s the executives of large industrial corporations had joined the chorus. The coalition also encompassed tens of millions of homeowners and shareholders. Always relatively large in the United States, this rentier middle class was subsequently expanded and consolidated by decades of neoliberal policy. Parrying charges that black Americans would suffer most from a recession, Volcker even worked to get members of the Congressional Black Caucus in his corner.6(<)meta charset='utf-8'(>)One month before the shock, he (<)a href='https://www.federalreserve.gov/monetarypolicy/files/FOMC19790918meeting.pdf'(>)told the FOMC(<)/a(>): “It’s not every day that we get a letter from the leader of the Black Caucus exhorting us to show more restraint on the money supply side. So I‘m going to carry that letter close to my heart, whatever we decide today.” He appears to have been referring to Maryland’s Parren J. Mitchell, who was chair of the Subcommittee on Domestic Monetary Policy in addition to head of the CBC. As important as such outreach may have been, it still required someone at the center, reaching out. As Antonio Gramsci recognized, a successful historic bloc requires alliances between social forces and leadership by a specific group. Looking at American history since the 1970s, who could possibly doubt which group has led?
A new policy regime
As Keynes knew, old ideas guide practical action long after circumstances—and the balance of forces—have changed. Central bankers and academic economists still struggle to shed patterns of thought formed during the Great Inflation and passed on through folklore disguised as professional expertise. In April 2008, when Timothy Geithner, then head of the New York Fed, told the FOMC: “I sat next to Paul Volcker when he gave his speech in New York the other day, and he said that the world today feels as it did in the 1970s.” Geithner complained: “I was alive in the 1970s, but only just. But I think it is better than that. It has to be better than that.” Confirmed inflation hawk Richard Fisher took the bait: “Somebody mentioned yesterday—it may have been Vice Chairman Geithner—that he wasn’t around in the 1970s. I actually sat by President Carter’s side” when he learned the hard lesson “that you cannot risk appearing to be complacent about inflation.”
As heads of the New York Fed, Geithner and Volcker were necessarily close to Wall Street. A map of their connections to the Rockefellers would be extensive. If they disagreed, it was not because they had different goals but because the younger man recognized a new situation. In 2008, Geithner located the crucial shift in the distribution of income: “It is very important that you have not seen any material pressure in broad measures of labor compensation. Profit margins are coming down, but they are still unusually high.” Yellen joined Geithner on the dovish side, arguing that labor statistics offered “further confirmation that at this point nothing is built into labor markets that suggests that we are developing a wage-price spiral of the type that was of such concern and really propelling the problems in the 1970s.” Yellen and Geithner had not become “more tolerant of inflation in the long run.” They simply asked why the Fed should tighten when all evidence pointed toward wage stagnation.
The stylized lessons of the 1970s were preserved not just in oral tradition but in formal economic models. In a 2014 FOMC meeting, John C. Williams noted that “that in many economic models, including FRB/US and most DSGE models, labor share is a key driver of marginal cost and inflationary pressures.”7(<)meta charset='utf-8'(>)FRB = Federal Reserve Bank; DSGE = Dynamic Stochastic General Equilibrium. He pointed out that “since the late 1980s, we have seen a substantial downward trend in labor share. And the fact that it has been going on for so long—it’s not related to the current recession or recovery—suggests that there really are structural, rather than cyclical, factors driving this, or at least most of this.” Williams was making a policy intervention here. Traditionally, the Fed would raise rates if they expected the wage share to rise. If the wage share was in secular freefall, monetary policy could be looser.
In July 2015, FOMC considered a paper by two staff economists, Andrew Figura and David Ratner.8(<)meta charset='utf-8'(>)The paper is also a point of reference in Anna Stansbury and Lawrence Summers, “(<)a href='https://www.brookings.edu/wp-content/uploads/2020/12/StansburySummers-Final-web.pdf'(>)The Declining Worker Power Hypothesis: An explanation for the recent evolution of the American economy(<)/a(>)” (2020).The paper argued that “the recent secular decline in the labor share,” if “driven by a reduction in worker bargaining power,” could mean that the natural rate of unemployment (the level consistent with price stability) was now lower than it had once been. This argument, explained staff economist David Wilcox, “casts greater doubt on one of the considerations that had been impeding us from marking down the natural rate.” At the time, Yellen and her colleagues believed the “natural rate” was 5 percent. This inclined them toward tightening despite the sluggish recovery.9(<)meta charset='utf-8'(>)Janet Yellen, “(<)a href='https://www.federalreserve.gov/newsevents/speech/yellen20150924a.htm'(>)Inflation Dynamics and Monetary Policy(<)/a(>)” (speech at the University of Massachusetts, Amherst, September 24, 2015). In the published version of the speech, Yellen concludes that “movements in labor costs no longer appear to be an especially good guide to future price movements.” Among her citations is another Fed staff paper, Ekaterina V. Peneva and Jeremy B. Rudd. “(<)a href='https://www.federalreserve.gov/econresdata/feds/2015/files/2015042pap.pdf'(>)The Passthrough of Labor Costs to Price Inflation(<)/a(>),” Finance and Economics Discussion Series 2015-042. Washington: Board of Governors of the Federal Reserve System. The decline of worker power provided one justification for letting the expansion continue.10(<)meta charset='utf-8'(>)Lael Brainard, a leading FOMC dove, had already cited the then-forthcoming Figura and Ratner paper as evidence that “a reduction in worker bargaining power or perhaps reduced levels of labor market churning are putting downward pressure on the natural rate.” Brainard, “The U.S. Economic Outlook and Implications for Monetary Policy,” (speech at the Center for Strategic and International Studies, Washington, D.C., June 2, 2015). What if the balance were to shift? Figura and Ratner suggest that: “if further increases in labor demand eventually increase worker bargaining power and the labor share—bringing them back to historically normal levels… the economy may end up… with a natural rate above levels of a decade ago.” For any gains they made at the bargaining table, workers would pay with their jobs.
Can the wage share ever rise?
In 2016, J.W. Mason offered a still-illuminating demystification of economic ideology. His case study was a New York Times op-ed in which University of Michigan economist Justin Wolfers argued that the Fed should continue to push unemployment lower. How low? Wolfers answered:
It is only when nominal wage growth exceeds the sum of inflation (about 2 percent) and productivity growth (about 1.5 percent) that the Fed needs to be concerned that the labor market is generating cost pressures that might raise inflation.
This was a relatively dovish position. But the technical language conceals a distributional assumption: the labor share of income should never increase. Inequality between labor and capital income can only be reduced if money wages grow faster than the sum of inflation and productivity increases (if wages do not keep pace with inflation, real wages will fall; if wages keep up with inflation but do not outstrip productivity growth, the wage share will remain constant even as real wages increase). But it is just this situation that Wolfers says the Fed ought to forestall, as if redistribution per se were a violation of basic economic literacy.
During the 1960s, redistribution was confronted more frankly. According to a popular stylization of “the golden age of capitalism,” these years saw the substitution of growth politics for redistribution. In the ubiquitous image, the pie grew so that everyone got a bigger slice, without any fights about where to stick the knife in. In fact, the years between 1945 and 1973 saw significant push and pull between wages and profits depending on the shifting balance of forces. The Keynesians of the Kennedy-Johnson Council of Economic Advisors (CEA)—arguably the preeminent institutional expression of the politics of productivity—affirmed the legitimacy of such distributional struggles. Thus, in the 1962 Economic Report of the President we read:
The proportions in which labor and non-labor incomes share the product of industry have not been immutable throughout American history, nor can they be expected to stand forever where they are today. It is desirable that labor and management should bargain explicitly about the distribution of the income of particular firms or industries.
The problem, according to the report, came when bargaining became inflationary. Happily, the first five years of the 1960s expansion combined growth with stable prices. But this depended on a lingering margin of idle workers and unused industrial capacity. Unemployment remained above 4 percent (the CEA’s full employment benchmark) until December 1965. No sooner was this goal reached than inflation reappeared. Throughout 1966, the White House struggled to hold down prices by limiting wage increases to below 3.2 percent (a stylized proxy for the rate of productivity growth in the overall economy). With inflation approaching 3 percent, this guideline would have meant a de facto wage freeze. As real GDP and profits continued to grow rapidly, even some within the White House recognized that their call for wage restraint was unpersuasive.11(<)meta charset='utf-8'(>)In May 1966, CEA Chair Gardner Ackley warned business leaders that “labor cannot be expected to continue honoring the guidelines as well as it has when it sees prices and profit margins continually rising.” Dean Baker, Robert Pollin, and Elizabeth Zahrt, “(<)a href='https://www.jstor.org/stable/40721680'(>)The Vietnam War and the Political Economy of Full Employment(<)/a(>),” (<)em(>)Challenge(<)/em(>) (May-June 1996).
Encouraged by low unemployment, workers began to win concessions with clear redistributive and inflationary implications. Meanwhile, productivity growth and profits declined, making wage increases more painful to employers than usual. For a few years, the wage share rose. But the working class offensive depended on the war (in 1968, one American in ten worked in defense-related employment). As Nixon selectively deescalated, tight labor markets disappeared into the rearview mirror. The prospect of downward redistribution crumbled into history’s ashtray like one of Volcker’s cheap cigars.
Will today’s experiment in managed expansion approach the redistributive horizons of the 1960s? The evidence is mixed. Yellen and Powell have already demonstrated that they mean what they say about not jumping at the first rumor of inflation. This is a small step but given the distressing regularity with which the FOMC members have contemplated throwing people out of work on the basis of anecdotes, it constitutes real progress.12(<)meta charset='utf-8'(>)Examples from the FOMC transcripts abound. In (<)a href='https://www.federalreserve.gov/monetarypolicy/files/FOMC19960924meeting.pdf'(>)September 1996(<)/a(>), Yellen passed along a report from one of her contacts who “described the pressures that an inability to hire entry-level workers was placing on supervisors who were forced to work overtime. He explained that quit rates were rising among his supervisors as a consequence. I think this is precisely the type of anecdote that one would expect to hear at the onset of an inflationary episode. If widespread pressures of this type emerge, it seems likely that firms eventually will be forced to bid up wages to retain workers and then pass through higher unit labor costs to prices.” The same month, with unemployment above 5 percent, (<)a href='https://www.federalreserve.gov/aboutthefed/files/laurence-h-meyer-interview-20101006.pdf'(>)Yellen personally lobbied Greenspan(<)/a(>) to raise rates (luckily for workers, he resisted the appeal). Powell even accepts the possibility of a rise in the wage share, having mused in 2018 that “the late 1990s episode of low unemployment saw wages rise faster than inflation plus productivity growth without an appreciable rise in inflation.”13(<)meta charset='utf-8'(>)This is one case where it may be illuminating to disaggregate the labor share. In 1998, production and nonsupervisory workers in the private sector saw their (<)a href='https://fred.stlouisfed.org/graph/?g=ETXu'(>)average hourly earnings(<)/a(>) increase by 4 percent—an improvement over recent experience, but still below the sum of (<)a href='https://fred.stlouisfed.org/series/CPIAUCSL'(>)price(<)/a(>) and (<)a href='https://fred.stlouisfed.org/series/MPU4910063'(>)productivity(<)/a(>) increases that year.
In the press, discussions of inflation show a newly sophisticated appreciation of the fact that price increases have many causes, with sector-specific supply chain issues receiving more attention than recalcitrant workers. Some advocates of economic expansion have begun to translate this new interest in bottlenecks into a political argument: public investment, by addressing supply-side issues, should be seen as a form of anti-inflationary policy. To the extent that such ideas become influential, it will be harder to enlist popular opinion in favor of simplistic anti-labor solutions to price instability.
But even with the economy still millions of jobs shy of its pre-pandemic level, there is already an organized attempt to cut short the expansion and declare the experiment a mistake. So far, the major backlash constituencies are low-wage employers and scorned economists, but their complaints will find a bigger audience at some point in the next few years. Joe Biden, the most pro-labor president ever, is already doing his best to ensure that Michal Kalecki’s eighty-year-old writings on full employment remain relevant to the TikTok generation. Even the most dovish mainstream economists continue to see rate hikes (eventually) as the key anti-inflationary policy, revealing the limited spread of more creative thinking about how to manage the price level.
The economists Lance Taylor and Nelson Barbosa-Filho suggest that Biden faces a policy dilemma. Reducing inequality is one of his stated goals. But an increase in the wage share will lead firms to increase prices to an extent that will force the Fed to raise interest rates. This monetary tightening, in turn, will adversely affect asset markets and generate “political resistance from Wall Street and affluent households.” Though the authors do not emphasize it, this would represent a historic shift in political economy. From Marc Hanna to Paul Volcker, rentier spokesmen have traditionally favored tight money, while workers and debtors have longed for expansion. If asset owners now have their own reasons to resist tighter Fed policy, the cause of full employment may have gained an awkward but powerful ally.
But redistribution is difficult because someone always loses. Even in a virtuous circle of demand-led growth, social conflict is never far away. We can glimpse one version of this dynamic in the recent history of Brazil, where the Workers’ Party (Partido dos Trabalhadores, or PT) governed from 2003 to 2016. As a detailed analysis by Pedro Loureiro shows, the PT did oversee meaningful redistribution within labor market incomes, and this redistribution did initiate a demand-led growth cycle. But in time, inflation began to exceed official targets. Rising prices, driven largely by wage gains in the service sector, disproportionately hit middle class consumers. Inflation inhibited further demand stimulus, bringing both growth and redistribution to a halt. Meanwhile, large sectors of the middle class deserted the PT, lending support first to the judicial-parliamentary coup against Dilma Rousseff and then to the presidency of Jair Bolsonaro. You could write a book on the differences between Brazil and the United States, beginning with a long chapter on their relative positions in the world monetary order. But the experience reminds us that economic expansions can generate self-undermining social conflicts.
It is not hard to understand how we can get both lack of inflation and an improvement in the unemployment rate when in fact wages are being suppressed. The problem is that we cannot have wages that continue to be depressed and have a 3 percent expansion of the real private economy; it just does not add up. One of two things can happen: In one, workers get restless, wages go up, the profit share falls, and there is upward pressure on inflation. That is scenario “one” … Or we get scenario “two,” where the demand is not there, we do not in fact have 3 percent expansion ex-government in the economy, and we get slower growth than the Greenbook14“The Greenbook is produced before each meeting of the Federal Open Market Committee. Using an assumption about monetary policy, the Research staff at the Board of Governors prepares projections about how the economy will fare in the future. These projections are made available to the public after a lag of five years.” is forecasting. My own bet is that the second result is more likely than the first.
In plain language, Lindsey laid out a choice between stagnation and redistribution, and predicted stagnation. It was a smart wager. The subsequent decades of low growth have only now given way to a new willingness to experiment with expansion. While we await the results, we can remind ourselves that we live in an economic system defined by conflict, as well as cooperation, between groups of people with divergent interests. At the Fed at least, no one has ever forgotten this.
The Great Recession is also substantially at fault for the student debt crisis, and the geographic contours of the downturn carry implications for how student debt has been experienced throughout the country. The number of borrowers and average loan balances were increasing rapidly before the onset of the financial crisis, thanks to the defunding of public university systems following the previous cyclical downturn in the early 2000s. The Great Recession put those trends into overdrive: with fewer jobs available and a more selective labor market, many young people were funneled into a higher education system already in the process of becoming much more dependent on students and their families paying hefty tuition, as opposed to state support. Those who had entered the system seeking credentials to boost their job prospects then graduated (or didn’t graduate) into a labor market still suffering from stagnant wages and disappearing job opportunities. Credentialization cascaded into higher loan balances as a share of income, rising delinquency, and eventually declining repayment rates.
Our research is the first, to our knowledge, to examine the Great Recession and the student debt crisis together at an individual, as opposed to macro, level. Our starting point is the economics literature that links exposure to the Great Recession to prolonged labor market distress lasting years after the Great Recession was formally over. Economic growth resumed by 2010, but the downturn’s negative effect on employment and earnings for those most affected lasted at least through the mid-2010s, and most likely through the present. This phenomenon is known as “hysteresis” in the labor economics and macro literature, drawing on the physics concept that refers to the path-dependence of outcomes in response to a transitory shock. The paper in that literature that most directly inspires the approach we take is Yagan (2019) “Employment Hysteresis from the Great Recession,” which finds that a local area unemployment rate increase during 2007–2009 caused lasting reductions in employment and earnings for individuals, regardless of whether they were unemployed during that period. Specifically, the paper estimated that a one-percentage-point unemployment rate increase was associated with a reduction in the probability of being employed in 2015 of 0.393 percentage points and a reduction in annual earnings of $997.
In this study, we consider the Great Recession’s effect on student debt–related outcomes, extending the logic of papers like Yagan’s to the student debt crisis, given the apparent relationship between labor market distress and prolonged enrollment in higher education, rising tuition, institutional segregation, earnings insufficient to pay off loans, and all the many other ways in which the student debt crisis is one facet of overall dysfunction in the labor market. We find that where a person lived during the Great Recession affected not only their employment outcomes, but also their student loan balances, eventually resulting in an accumulating burden of unpaid debt amidst a still-slackened labor market. Using a specification constructed to be as similar as possible to Yagan (2019), we show that an increase of one percentage point in the local area unemployment rate between 2007–2009 is associated with an increase in student loan balances of around $812 by 2019, an increase in required monthly payments on student loans of $5.10, and a reduction in the probability of having fully repaid outstanding student loans by 2019 of about 0.75 percentage points. These effect sizes are large, the more so because the Great Recession shock was severe: the median level of the shock is approximately 4.5 percentage points. Thus, our estimates imply that someone subjected to the median shock would have a student loan balance over $3500 higher than they would have had the Great Recession not occurred. Moreover, we find larger increases in loan balances for the younger cohorts of borrowers within our overall sample of borrowers aged 18–34 in 2009, suggesting that the effect of the Great Recession on the student debt crisis was even worse for those who were not yet old enough to have taken on student debt in 2009.
Data
The basis for our study is a panel dataset of the credit reports of one million student borrowers starting in 2009 and lasting a decade, until 2019. The sample frame is that an individual had to be between the ages of 18 and 34 in 2009 and have an outstanding student loan balance at that time.1(<)meta charset='utf-8'(>)In fact the panel includes individuals who had had a student loan outstanding within two years prior to the panel start date of 2009, but we exclude everyone who did not have student debt outstanding at the end of our Great Recession “shock” interval in 2009. We observe some demographic characteristics directly in the sample, including age, gender, and several geographic variables derived from the individual’s address.
We further observe individual-level, credit-relevant outcomes separately for each year. For the purpose of this study, we focus on student debt–related outcomes: total balance on all outstanding student loans, total monthly payments on outstanding student loans, and a variable we constructed to encode whether an individual who had outstanding student debt in 2009 had paid off all their student loans by the relevant subsequent year. We construct this last outcome by observing the succession of outstanding balances: if an individual has declining total balances year-by-year, and reaches a balance of zero on their outstanding loans by a given year, we code that person as having fully repaid their loans in that year. Provided we don’t observe a subsequent positive balance, we assume that that remains the case going forward. Previous work in this series has documented repayment among this cohort of student borrowers: the median borrower still had approximately 37 percent of his or her 2009 balance outstanding in 2019, and over 25 percent of borrowers had more student debt outstanding in 2019 than they did in 2009.
The premise of this study is that the geographic area in which someone lived during the Great Recession is a proxy for how severely they were affected by the Great Recession, similar to the study by Yagan. It thus uses the change in unemployment rate between 2007 and 2009 in the commuting zone where an individual lived in 2009, the first year of our data, as an index for how “shocked” that individual was by the Great Recession. Commuting-zone-level changes in unemployment rates are available from Professor Yagan’s replication files for his 2019 paper, constructed from county-level unemployment rates in the Bureau of Labor Statistics’s Local Area Unemployment Statistics and mapped in Figure 1.
where i indexes an individual in the panel data, c refers to the local area (commuting zone) in which that individual resided in 2009, and t refers to one of the “outcome” years 2010–2019. In this instance, SHOCK refers to the percentage point change in the commuting zone unemployment rate between 2007 and 2009, in line with Yagan (2019). The regressors x refer to individual-level covariates, separated into those observed for an individual in 2009 and those observed in the outcome year 201t. The outcome of interest y is expressed as the difference in that outcome in 201t relative to the baseline year 2009. ε is an individual-year disturbance term assumed to be uncorrelated with the value of the shock.
The coefficient of interest in this regression is β, which is interpreted as the causal effect of a one-percentage-point higher value of the shock (i.e, an increase in the unemployment rate of one percentage point between 2007 and 2009 in the commuting zone in which individual i lived in 2009) on the outcome of interest, denominated in units of the outcome of interest.
Covariates include age, gender, student loan balance in 2009, and the contemporaneous unemployment rate in the commuting zone in which individual i resides in the regression outcome year (which need not be the same commuting zone as in 2009). Everyone in the panel was a student debtor, at least in 2009. The controls seek to isolate the effect of the Great Recession among individuals in that broad group, i.e. comparing individuals of the same age, gender, and outstanding student loan balance in 2009. The idea is that individuals in the overall sample may be at very different places in their educational attainment or economic life cycle, and we want to compare otherwise-similar individuals depending on how affected they were by the Great Recession to ascertain the effect of the Great Recession on student-debt-related outcomes. The identifying assumption is that conditional on those covariates, differences in outcomes between individuals (with the same age, gender, and student loan balance in 2009) that emerge subsequent to 2009 are caused by differences in the severity of the Great Recession shock.
Figure 1. This image is based on Figure 3 of Yagan (2019), mapping octiles of the Great Recession shock by commuting zone. The Great Recession shock is the change in commuting zone unemployment rate between 2007 and 2009. Higher values (darker shading) signify a larger increase in the commuting zone unemployment rate, i.e. the Great Recession was more severe.
Results
As stated above, we focus on three student debt–related outcomes of interest: total student loan balance at the individual level, total required monthly payments on student loans, and whether an individual completed repayment on all outstanding student loans. For each of those outcomes, we report the regression results for each year after 2009. All outcomes are defined relative to a 2009 baseline, given that all individuals in the sample had student debt outstanding in that year. The first two outcomes of interest are a dollar change since 2009, while the “completed repayment” outcome is binary.
Table 1 reports the regression of change in student loan balance between 2009 and 2019 on the shock and covariates. The preferred specification is given in column 5, with all covariates added. The point estimate 812.2 signifies that a one-percentage-point-higher unemployment rate change between 2007 and 2009 corresponds to an increase in outstanding balance between 2009 and 2019 of \$812.20. All regressions utilize robust standard errors clustered at the level of the commuting zone of residence in 2009.
It’s also worth noting some of the patterns in estimated coefficients on the covariates: women appear to take on more student debt than men and, given this is a sample of student debtors aged between 18 and 34 in 2009, younger borrowers in that sample end up taking on more student debt subsequent to 2009 than older borrowers. Probably for related reasons, borrowers who had more student debt already outstanding in 2009 subsequently took on less. These two facts highlight life cycle heterogeneity present in the sample. Borrowers who lived in areas with higher unemployment rates after 2009 also took on more debt.
Table 1. This regression table reports the results of regressing the difference between 2019 and 2009 loan balance on the Great Recession shock variable and controls. The top row is the estimated coefficient of interest, and values can be interpreted in dollar amounts. Robust standard errors in parentheses.
Figure 2 visualizes these results in two different ways: first, by running the regression separately in each year from 2010–2019, it shows an increasing effect of the Great Recession shock, suggesting that the effects are not dissipating over time, but rather the opposite. Second, for the outcome year 2019, the binned scatterplot depicts ventiles of the shock on the horizontal axis. The vertical axis plots the average value for the outcome within that shock ventile (net of the same controls used in column 5 of regression Table 1). The best-fit line plots the estimated relationship, and thus its slope is approximately equal to the regression coefficient of 812.2. Note that the domain for the shock is between just under two percentage points for the least-shocked 5 percent of commuting zones (i.e., their unemployment rate rose by slightly less than two percentage points) and over seven percentage points for the most-shocked 5 percent. Negative numbers on the vertical axis represent declining average student loan balances between 2009 and 2019, and positive numbers represent increasing balances.
Thus, altogether the takeaway from Figure 2 is that student debtors who lived in the most-shocked commuting zones experienced rising student loan balances between 2009 and 2019, and people who lived in the least-shocked commuting zones experienced declining balances, with the gap between them widening over time.
Figure 2. For each of these plots, the outcome of interest is the change in total student loan balance between 2009 and the relevant outcome year, which is 2019 in the case of the binned scatterplot at the bottom. We run the regression separately in each year and plot the coefficient of the Great Recession shock year-by-year at the top. At the bottom, the binned scatterplot depicts ventiles of the shock value and the corresponding average change in total loan balances for individuals in that ventile of commuting zones.Figure 3. This maps octiles of the average change in student loan balance by commuting zone between 2009 and 2019. Higher values (darker shading) signify a larger commuting zone average change in outstanding student loan balance.
Table 2 reports the same regression specifications as in Table 1, but with the change in total monthly payments on student loans between 2009 and 2019 as the outcome of interest, rather than the change in total outstanding balance. Here the point estimate in the preferred specification is 5.1, meaning that a one-percentage-point-higher change in the unemployment rate in 2007–2009 corresponds to a $5.10 higher student loan payment in 2019 relative to 2009. Figure 4 consists of the same two plots as in Figure 2, for this additional outcome of interest.
Table 2. This regression table reports the results of regressing the difference between 2019 and 2009 monthly payments on student loans on the Great Recession shock variable and controls. The top row is the estimated coefficient of interest, and values can be interpreted in dollar amounts. Robust standard errors in parentheses.Figure 4. For these plots, the outcome of interest is the change in total monthly payments on student loans between 2009 and the relevant outcome year, which is 2019 for the binned scatterplot at the bottom. We run the regression separately in each year and plot the coefficient of the Great Recession shock year-by-year at the top. At the bottom, the binned scatterplot depicts ventiles of the shock value and the corresponding average change in total monthly payments for individuals in that ventile of commuting zones.Figure 5. This maps octiles of the average change in monthly student loan payments by commuting zone between 2009 and 2019. Higher values (darker shading) signify a larger (i.e., less negative) commuting-zone-average change in monthly student loan payments.
There are several things to note about this second monthly payments outcome: first, it appears to be a lagging indicator, relative to total student loan balance, likely because of the deferment that student debtors enjoy for the time following the issuance of their loans if they remain enrolled, and (usually) for six months following graduation. Hence required payment amounts lag loan balances, and the Great Recession effect does not emerge until 2013 or 2014, whereas it appears in 2010 for outstanding balances. Second, for the change in monthly payments outcome, almost all ventiles of the shock variable show declining payments between 2009 and 2019, but the decline is smallest in the most shocked. This likely relates to two things: increased enrollment in income-driven repayment after 2016, resulting in lower payment amounts relative to income but also reduced repayment of outstanding balances. That means that required payments last longer, and (consequently) a smaller share of borrowers in the most-shocked commuting zones reach full repayment by the end of the sample.
Table 3 focuses on this last outcome of interest: likelihood of full repayment. Note again that this outcome is specified in levels, i.e. a binary outcome for completed repayment, and not a difference relative to 2009 (since everyone in the sample had outstanding student debt in 2009). The regression table indicates that a one percentage point-higher unemployment rate change between 2007 and 2009 corresponds to a 0.75-percentage-point-lower probability of full repayment in 2019. The effect of the shock on full repayment also amplifies over time, as with the previous two outcomes.
Table 3. This regression table reports the results of regressing the probability of having fully repaid student loans by 2019 on the Great Recession shock variable and controls. The top row is the estimated coefficient of interest, and values should be interpreted as percentage-point change in probability. Robust standard errors in parentheses.Figure 6. For these plots, the outcome of interest is the probability of having fully repaid student loans by the relevant year. We run the regression separately in each year and plot the coefficient of the Great Recession shock year-by-year at the top. At the bottom, the binned scatterplot depicts ventiles of the shock value and the corresponding average probability of full repayment for individuals in that ventile of commuting zones.Figure 7. This maps octiles of the share of individuals who had completed the repayment of their student loans by commuting zone in 2019. All individuals in the panel start out with student debt in 2009. Higher values (darker shading) signify a higher commuting zone share of individuals who have fully repaid their student loans.
Threats to identification
Relative to the estimation strategy on which this study is based, the one adopted in Yagan (2019), this study has two shortcomings, one minor and one more significant. First, we only start to observe the individuals in the panel in 2009, at the end of the Great Recession shock interval rather than the beginning, and we observe fewer (and likely less reliable) demographic and economic covariates in the credit reporting data (age, gender, and “starting” student loan balance) than in the previous study’s tax return data (age, pre-recession earnings, and pre-recession industry of employment). In that sense, there is probably more residual variation in the population net of controls in our study than in Yagan’s, when the design seeks to create as homogeneous a sample as possible that differs only in the extent to which it is affected by the Great Recession (although it should be noted that our sample is inherently more homogeneous in age and the fact that they’re all student loan borrowers). We view these deficiencies as minor, however, since variation in terms of when someone was affected matters less than the degree to which they were affected. Yagan (2019) shows some variation along these lines, for example among the subsample subjected to mass layoffs (who experienced the shock of the Recession earlier) and the subsample who worked in national retail chains (for whom the effect took longer to materialize).2(<)meta charset='utf-8'(>)The inclusion of these two subsamples in the Yagan study isn’t meant to highlight variation in the time of the Great Recession’s effect, but rather to focus on subsamples in which there might be an even greater degree of homogeneity, aside from exposure to the Great Recession shock. Notwithstanding those differences, though, the timing for the Great Recession effect on both employment and earnings in both subsamples was qualitatively similar in the following years 2010–2015.
The bigger threat to identification is that we do not observe any of our student debt–related outcomes prior to 2009, which means that we cannot directly reject pre-trends in those outcomes among individuals who lived in commuting zones that were differentially affected by the Great Recession. The problem with our inference would arise if the commuting zones most severely impacted by the Great Recession were those in which the student debt crisis had been getting worse before 2007, relative to the commuting zones less affected by the Great Recession. That would mean that the effect we attribute to the Great Recession’s severity might in fact be caused by something else, violating the identification assumption that the error term in the regression equation is uncorrelated with the shock regressor. Note that this is relevant for differences in trends, not levels: it doesn’t matter if the commuting zones most affected by the Great Recession were also already those most affected by the student debt crisis: the regressor of individual-level 2009 student loan balance should account for that level effect. What would undermine the inference is if balances were rising faster in the most-affected commuting zones, versus the less-affected ones, prior to the onset of the Great Recession.
We nonetheless feel fairly confident in placing a causal interpretation on our Great-Recession-related shock’s effect on student debt outcomes. There is substantial geographic variation in the severity of the student debt crisis, but that variation is driven mostly by state-level policy variation—the degree to which public higher education systems depend on public funding versus tuition, as well as geographic variation in different types of institutions with varied business models. (For example, living near for-profit institutions correlates to increased student loan balances and other pathologies of student debt.) These things are not closely related to the severity of the Great Recession shock, at least not prior to the Great Recession. It is likely that the Great Recession may have caused states to disinvest from public higher education and allowed for-profit institutions to enter and expand in areas that suffered severe labor market distress, but these responses would have happened during and after the Great Recession. Thus these mechanisms are some of the many that are properly understood as giving rise to the causal relationship(s) we estimate.
Finally, Yagan (2019) is able to test for pre-trends and rejects them in relation to the outcomes that the paper focuses on: employment and earnings. It would be surprising, then, if there were pre-trends in our student-debt-related outcomes, less closely related to the causes of geographic variation in the Great Recession’s effects, but not in outcomes that are more closely related to the variation that manifested during the Great Recession. We also include the contemporaneous unemployment rate in our regression specifications to try to control for possible proxies for geographic variation in long-term student-debt-related outcomes and also with the Great Recession shock itself.
Interpretation
The Great Recession was undoubtedly a major impetus for the student debt crisis: college enrollment increased, student loan levels shot up, young workers in particular had trouble accessing full-time employment early in their careers and thus remained in education longer, at the same time as student-facing costs were rapidly increasing due to state disinvestment. As time went on, increased loan amounts, particularly among so called non-traditional populations, caused rising delinquency and default on student loans, giving way to rising enrollment in Income-Driven Repayment by the late 2010s, resulting in lower repayment. That broad narrative is well-known, though this study is the first to have documented it in individual-level panel data. Doing so demonstrates that student debt represents one facet of poor labor market functioning in younger cohorts entering the labor market in the aftermath of the Great Recession. Yagan (2019) highlights the exit-to-nonemployment channel for the employment effects documented in that paper, and one possible nonemployed labor market state may be enrollment in higher education, resulting in rising student indebtedness.
The ostensible purpose of taking out student loans to finance higher education is that it is an “investment” that “pays off” in the form of higher earnings and more secure employment for higher-skill workers. That idea has motivated policies that ushered in the student debt crisis, such as rising maximum loan levels and the proliferation of accredited degree programs, and implies that those with student debt must be better-off than those without, since they also have more education and thus more skills, resulting in higher earnings. The inference of this study is the opposite—student debt signifies worse luck in the labor market, in the sense that it’s associated with having experienced a more severe Great Recession shock, which has lasting effects in terms of worsening labor market outcomes. These results therefore strongly contrast with the view that there’s nothingsignificantlywrong with rising student loan balances and the resulting non-repayment of outstanding loans because student borrowers “do well in the labor market” and are privileged relative to the rest of the population.
Modestino, Shoag, and Ballance (2019) show that during the Great Recession, when labor markets were slack and employers were able to be selective about which workers they hired, job ads specified higher education, experience, and skill levels for a given job title. That effect trailed off as the recovery from the Great Recession played out, but the basic insight of that research is that the “skills” required of a given job are not (entirely) intrinsic to that job, but rather determined by slackness in the labor market shifting greater bargaining power to individual employers. It’s not hard to imagine this dynamic driving a response from workers to seek credentials (or “skills”), and thus take on more student debt. If education and the debt required to obtain it doesn’t correspond to higher salaries, then, it’s not surprising that they’d have more trouble paying it off.
Moreover, the panel this study utilizes consists of people who already had student debt in 2009, and we show that the effect of the Great Recession on student debt accumulates over time for that group. Given that pattern, there are probably more dire effects of the Great Recession shock on younger cohorts that did not yet have student debt in 2009 but who entered labor markets seemingly permanently slackened by the effect of the Great Recession. The literature on the Great Recession’s effect on job ladders and economic life cycles tends to focus on people who were in the labor market during the Great Recession, and it implies that that group is permanently, but anomalously, worse-off than cohorts both preceding and succeeding it. It may be that subsequent cohorts are in fact even worse off. The fact that the youngest borrowers present in our panel tended to take on the most debt between 2009–2019 points in the same direction. Student loan repayment across cohorts is undoubtedly getting worse over time, and that trend persisted despite the relatively healthier labor market of the late 2010s, prior to the Covid-19 recession. All of that suggests that subsequent cohorts of borrowers would be worse off relative to the cohort studied here.
A major outstanding question from this study relates to the precise interpretation of the Great Recession shock, and the resulting hysteresis, in labor economics terms. Did the recession represent a decline in labor demand against a more-or-less constant labor supply curve, or did the resulting power shift in the labor market mean that workers became less wage-elastic vis a vis individual employers due to the paucity of outside job opportunities, and thus better able to be exploited? In reality, the answer is probably both, but interpretation of the various mechanisms awaits further work that is able to distinguish between these two causes.
Why did the Ever Given capture our collective imaginations? In its moment in the spotlight, the poet Kamran Javadizadeh tweeted: “I too am ‘partially refloated,’ I too remain stuck in the Suez Canal.” Two fluorescent yellow-vested construction workers with an excavator—lego-like compared to the gargantuan hulk of the vessel—attempted to wrench the giant ship from the sand bank. Dredgers and tugboats aided by rising tides finally refloated the massive freighter, launching it back on its voyage from Yantian to Rotterdam.
While the immediate cause of the ship’s running aground may have been a sandstorm blowing in from the Sahara, the vessel’s size—it is one of the world’s largest container ships—was a decisive factor. Its stymied trip was symbolic of the shorted circuits of supply chains at the start of the pandemic. Like the products it carries, the ship is a transnational project: Japanese-owned; Taiwanese-leased; German-managed; an Indian crew; its Panamanian flag indicating the ship’s registry in that offshore haven which grants asset-owners tax exemptions and enables the employment of cheaper foreign labor. This whale of a ship beached by the khamsin—seasonal windstorms (the ‘winds of God’) that can wreak havoc for fifty days and nights—temporarily blocked the liquid arteries of global trade.
The Suez is a man-made strait through which more than 12 percent of world trade and 10 percent of crude oil flows. On any given day, its waters carry one-third of global container ship traffic. A short-cut to Europe, the canal is a conduit in the contemporary maritime silk road that ribbons across the South China Sea, through the Malacca Straits to the Bay of Bengal and the Arabian Sea into the Gulf of Aden. From its southerly entrance in the Red Sea, the Suez laboriously winds into the Mediterranean, channeling iPhones and Pelotons towards the Global North. The incident in the Suez was so evocative because it was a sudden reminder of the “global economy” as a set of real-time processes involving minerals, material, management, and labor. Easily forgotten at the consumption end of the supply chain, and a far cry from comparative advantage models taught in economics classrooms, these are the processes that shape the actual organization of the shipping industry, transnational production, and global finance.
In sharp juxtaposition to the breathless temporality of financial markets, the stuck ship was the global economy materialized—just-in-time production chains come to a halt. As a metonym for the global economy, the Ever Given is somewhat Hayekian: a cosmopolitan realm of global capital and lex mercatoria where cross-border trade is primordial and commercial law critical to the expansion of the “extended [market] order.” The Ever Given is emblematic of the barge economy—the offshored and outsourced platforms in which labor-standards and corporate regulation are circumvented to generate profits. No wonder Captain Karan vir Bhatia—one of almost half a million seafarers stranded at sea due to Covid restrictions—described his field of employment as a “shadow sector.”
Largely confined to the extractive and exploitative rungs of global-value-chains, markups for producer firms in developing countries have been declining since 2018. For poorer economies, participation in transnational supply chains has meant increases in labor productivity alongside declining real wages. In contrast, firm mark-ups have increased sharply in Europe and North America—home to the corporations that capture the bulk of profits by owning the intellectual property embedded in products from apparel to pharmaceuticals.
‘Capital requires the state’
The obstruction of a vital shipping lane blocked the passage of at least three hundred other vessels, including oil tankers and, apparently, one Russian warship. Looting of the stalled vessels—“stranded assets” or “sitting ducks” as they have been variously called—was a much-reported concern. Ships bearing jet fuel, live animals, grains, and Ikea furniture were rerouted back through the text: heavily militarized Horn of Africa—passing by war-ravaged Yemen—to the longer route to Europe via South Africa. Shipping corporations called the US Navy to protect their assets from seafaring pirates. As Anwar Shaikh has written: “Capital requires the state and the state requires… the proper functioning of capital.”
The Suez has a history of being weaponized with consequential outcomes for global trade. The 1967 Arab-Israeli war, which led Egypt to close the canal, trapped fifteen cargo ships in the Suez for eight years. Maritime trade was forced to take the longer passage around the Cape of Good Hope propelling a demand for bigger Japanese-built ships. In its very construction as colonial infrastructure the Suez figured from the start in relations of economic dominance and subordination, and inter-imperialist rivalries. More than a century ago, Rosa Luxemburg wrote that, with the Suez, Egypt became “caught in the web of European capitalism never again to get free of it.” The mid-nineteenth-century French-led construction of the waterway on the backs of a million and a half fellaheen—state-conscripted labor—thrust Egypt into a colonial mode of capitalism. Funding this decade-long infrastructure project which ended up costing $1.9 billion (in today’s terms) required sovereign debt issuance. The sterling loans were rerouted back to Europe to purchase European capital goods and repaid through the onerous taxation of the Egyptian peasantry. Suez “formed the nucleus,” wrote Luxemburg, “for Egypt’s immense national debt which was to bring about her military occupation by Britain.”
Despite having left the Commonwealth in 1947, Egypt was coerced into reducing its spending on dollar oil (produced by American firms) and purchasing sterling oil instead. Angered by Anglo-American backtracking on promised financing to help construct Egypt’s Aswan Dam, Gamal Nassar nationalized the (British-French) Suez Canal Company in 1956, impeding the movement of sterling oil from Iran through the Mediterranean. When British, French, and Israeli forces invaded Egypt, the Eisenhower administration withheld financial support to the UK, which compelled the British to retreat. The crisis marked the end of sterling oil and set the stage for the dominance of the petrodollar and Pax Americana.
In the following decades, the Suez remained critical to the construction of the postwar American order. It was in Suez where the first UN peacekeeping mission originated. After the crisis, Egypt, which houses the largest inventory of major weapons in the Middle East and North Africa, become thoroughly enmeshed in the West’s military-industrial complex. And Britain’s balance of payments instabilities in the aftermath of the Suez Crisis led to restrictions placed by the Bank of England on British banks lending to non-sterling areas. These contingencies helped shape the City of London (aided in no small way by Wall Street) into the center of offshore dollar-funding.
Formal empire has given way to the imperialism of bond markets, and the entwinement of monetary and political sovereignty—and the inequality between sovereigns who have such autonomy and those who don’t—persists. Recall that at the start of the Covid-19 pandemic, non-resident financial flows exited developing and emerging economies en masse only to rebound after the US Federal Reserve pumped liquidity into global credit markets. Monetary and fiscal relief amounted to one-fifth of GDP in advanced economies but only seven percent of output in smaller economies and a paltry two percent in the poorest of nations. Acutely sensitive to the ebbs and flows of the global dollar cycle—in which global financial conditions tighten with dollar appreciation and vice versa—a year into the pandemic, emerging markets, once again, are rattled as rising interest rates on long-term US treasuries make for jittery financial flows to the Global South.
Despite a decade-long growth in local-currency bond markets in emerging economies, it is still cheaper for them to borrow in dollars. This means that for peripheral sovereigns, monetary sovereignty is the less efficient market-outcome unless they find themselves, as several now do, in default. Then the costs of borrowing in foreign currency become exorbitant. Even prior to the pandemic, emerging markets (EM) faced a new mutation of ‘original sin’ whereby dollar strengthening spurred foreign investors (facing both local-currency and return losses) to sell off their local-currency EM bond-holdings. The great irony is that local currency borrowing, meant to stabilize emerging markets from currency mismatch and bolster monetary sovereignty, leaves EMs more susceptible to global market sentiment as dollar appreciation prompts foreign investor exit, amplifying local currency slides. On the other hand, borrowing in dollars means that EM sovereigns face a less skittish foreign investor base.
This structural dilemma rooted in the hierarchical architecture of the international monetary system reinforces the EM risk premium while strengthening dollar dominance. Despite the immense challenges confronting developing economies during this crisis, the IMF’s tepid response has been to urge them to withstand larger exchange rate devaluations with little acknowledgment of the deleterious impact of currency volatility on peripheral economies. The IMF itself has only deployed about 10 percent of its monetary firepower. Austere conditionalities continue to be embedded in its lending programs. The leading multilateral lender is still mulling over the US Treasury Secretary’s Janet Yellen’s proposal to issue $650 billion in new SDRs and has indicated moving on this front in August. In any case, this belated funding—even if all of it were to be funneled to the Global South—falls far short of the $3 trillion required to help EMs navigate the crisis.
Post-carbon politics
The Ever Given also compels us to grapple with the consequences of consumption-led growth in the Global North on climate change. Even today, about one third of world trade is in oil and related products. Shipping’s contribution to fossil fuel emissions is about the same as that of aviation. Unlike planes, ships can be retrofitted to reduce emissions. The goal of net zero emissions by 2050 will likely require a multilateral resolution of global trade and financial imbalances. Even if, as Michael Pettis and Matthew Klein have argued, Chinese workers increase their consumption spending, the question arises: by how much will increasing China’s consumption-share of GDP reduce global imbalances? Export-oriented growth, premised on a peripheral sovereign’s accumulation of hard currency, itself perpetuates global trade and financial imbalances.
Decarbonization requires massive investment in alternative energy and green infrastructure which, given present international monetary arrangements, can most efficaciously be financed with dollar-funding. At its root, however, decarbonization requires an overhaul of the international monetary hierarchy that perpetuates economic and ecological imbalances. The fleeting commitment to green energy embedded in the Biden administration’s infrastructure bill proposal, the modest 1 percent increase in new discretionary defense spending, and Yellen’s push for a global minimum corporate tax are, figuratively speaking, green shoots. The infrastructure proposal has shunned private funds thus far, but powerful actors have already begin to advocate public-private partnerships for a green recovery in the Global South. This is a double-edged sword, one that is bound to entrap developing countries in further external indebtedness.
Josh Younger’s calculations) of the costs of dealing with climate change suggest that in a zero-bound interest rate environment, delaying climate-change mitigation will lead to mushrooming costs. For emerging markets, these costs are even greater post-pandemic. Last year’s monetary easing propelled record issuance in foreign law governed, foreign currency denominated sovereign bonds in the Global South. Meanwhile efforts to restructure sovereign debt have stalled with the G-20 debt service suspension initiative extended until the end of the year. Pandemic notwithstanding, private creditors have continued receiving payments from cash-strapped sovereigns. In its mission to build a global repo market in African sovereign debt, the UN Economic Commission for Africa is lobbying for private-sector creditors to be exempted from current sovereign-debt restructuring negotiations altogether. The problem with the ECA-style collateral-based financing is that the risks associated with selling infrastructure-as-an-asset-class fall wholly on the EM sovereign-debt issuer while the rewards largely accrue to foreign investors.
In the event of dollar appreciation, the probability of dollar-liquidity shortages transpiring into external debt crises increases. Other potential sources of instability include the vulnerability of EM bond markets to sudden shifts in global market sentiment. Interest rates, however low, are greater than the current GDP growth rate of some sovereign borrowers. EM central bank asset purchases of sovereign and private-sector debt, while commendable in the face of this crisis, do transfer risk from private to public balance sheets. Such risk bearing is easier for key currency issuers to manage than it is for peripheral sovereigns whose fiscal and monetary capabilities are much more constrained. With effective vaccination far from assured for the vast majority in the Global South, in the near term, new mutations of the coronavirus or yet another catastrophic climate event may find EM fiscal and monetary authorities depleted of any monetary arsenal altogether.
The pandemic-led central banking revolutions in the Anglo-American heart of global finance—where monetary financing is no longer taboo—must be tethered to de-weaponizing transnational relations. Countries that have contributed least to global carbon stocks, but will be disproportionately harmed by climate change should be aided in their transition to low-carbon economies. Innovative financial instruments such as debt-nature swaps could play a role here. Such initiatives should not be left to unaccountable foreign private finance but could operate through the global network of central banks and involve central bank digital currencies.
Pending investigations on the Ever Given have prevented the ship from actually leaving Egypt. This ill-fated vessel is presently impounded midway through the Suez in the Great Bitter Lake—a poignant name for indefinite legal purgatory. Hopefully, as they navigate a difficult path towards recovery, developing economies will not be faced with a similar impasse.
 World