Category Archive: Analysis

  1. Town & City

    Comments Off on Town & City

    Earlier this month, Brazilians went to the polls in an election billed as the most momentous since democratization in 1985. Far-right president Jair Bolsonaro faced off against former two-term president Luiz Inácio “Lula” da Silva. Though Lula did win the first-round election by more than 5 percentage points, or 6 million votes, it was not enough to clear the 50 percent threshold needed for first-round victory. The opponents will face a polarizing run-off on October 30. 

    In Brazil, the national and state-level executives are elected by direct proportional representation for four-year terms. This is also the case with the Senate, comprising eighty-one seats, each serving eight-year terms. The lower-house national legislature, the Chamber of Deputies (comprising 513 seats, each serving four-year terms) is elected via open list proportional representation through state-based lists, with a 2 percent threshold and a rather complicated alliance system between parties. As a result, there has systematically been a disjuncture between the executive and the legislative in the country, and presidents need to cobble together shifting alliances to try and form the temporary majorities they need to legislate. At best this has led to weak governments, and at its worst it has been the breeding ground for semi-legal practices and various corruption scandals over the years.

    The results from Brazil’s first round show a sharp turn to the right in the legislature—for which there are no run-offs—as well as in gubernatorial races. In both upper and lower houses, the number of right-wing members is set to reach a historic high. In the Senate, Bolsonaro’s Liberal Party won eight of the twenty-seven Senate seats up for grabs, making it the largest party in the chamber. Other right-wing parties also made substantial gains, such as União Brasil which took five more seats, bringing its total to eleven. Meanwhile, Lula’s Workers’ Party (PT) made only modest inroads, gaining two seats in the Senate to take its total to nine. Other left-wing parties failed to increase their representation. 

    A similar pattern can be seen in the lower house. There, too, the right made gains and the leadership will remain in the hands of the Centrão, the amorphous, right-leaning group of Deputies best known for their skill in pork-barrel politics and for selling, at eye-gouging prices, their support to the government of the day. Nevertheless, there were some developments that went against the grain: in particular, there was a significant increase (from seventy-seven to ninety-one) in the number of women deputies elected, and a small rise in the number of self-declared black and brown deputies, from 124 to 135, even if they continue to be woefully under-represented. 

    There are two main implications from these results. First, whoever is elected in the run-off will have his work cut out to legislate—all the more so for a Lula presidency. One can expect more of the horse-trading politics that have characterized executive-legislative relations in Brazil for decades. Second, while the executive remains up for grabs, the results demonstrate the strength of the new right. If Bolsonaro’s sweeping victory in 2018 could in part be read as a widespread rejection of established politics, the same cannot be said for 2022. In a deeply polarized country, this novel right-wing politics—centered around a punitive approach to public security, conservative values, and an economic agenda that is unclear beyond its unflinching support to agribusiness—is now a consolidated force, which encompasses but exceeds Bolsonaro himself. Understanding this force and its supporters is perhaps the key challenge over the medium term. 

    The standard map

    A standard narrative about the Brazilian constituency in recent years is that the poorer north and northeast tends to vote for the Workers’ Party, while the wealthier south(east) throws its support behind the right. Standard visual representations of the Brazilian vote—spanning the first two rounds of 2018, plus the first round of 2022—seem to confirm this reading. The north and northeast of the country are depicted as broad swathes of red, albeit with some exceptions—most prominently the blue colored state of Roraima in the far north. The south, by contrast, is shown to be overwhelmingly colored blue, representing Bolsonaro’s sweeping victory there.

    Figure 1: Map of presidential election results in Brazil, 2018 (first and second round) and 2022 
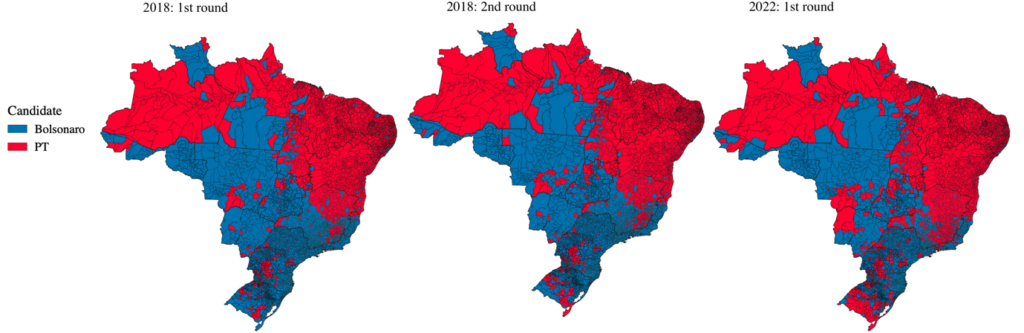
    Author’s maps based on data from TSE.

    This north-south divide has socio-economic roots, as the north has historically tended to be poorer and less developed. Whilst there are complex reasons for this pattern of uneven geographic development, it can be traced to political and economic dynamics dating back to the nineteenth century. The coffee economy, which kicked-off in the early nineteenth century and, later, industrialization in the twentieth century, were concentrated in the southeast of the country, especially in Brazil’s most populous city, São Paulo. Meanwhile, the state apparatus was housed in Rio de Janeiro, the national capital until 1960. These two mega cities drew internal migrants from other regions of the country and concentrated resources, political power, and economic growth in the southeast. 

    Nevertheless, as André Singer has shown, the PT’s popularity in the north and northeast is a relatively recent occurrence. Before it came to power in 2002, the party had drawn its main support from better-educated, higher-income voters in the big cities, largely in the south; after 2006 this changed, and the PT became most popular among lower-income groups in smaller municipalities.1See especially his 2012 book: (<)em(>)Os sentidos do lulismo: reforma gradual e pacto conservador(<)/em(>). This was in large part thanks to the PT’s redistributive policies which lifted the minimum wage and introduced conditional cash transfers like the famous Bolsa Familia. The PT’s policies were squarely aimed at the lowest (and the very highest) end of the income spectrum, rather than expanding the high-paid labor market in such a way that would have attracted the middle class, and so the shift was consolidated. Ongoing corruption scandals—by no means unique to the Workers’ Party, but nevertheless a recurring feature of its administrations—further corroded middle-class support. The PT’s expansion of finance and higher education to previously excluded groups also brought the latter closer to the party—and especially to the figure of Lula, who himself had been a migrant from the northeast to São Paulo. As redistributive and growth-enhancing policies had a greater impact in the poorer, northern parts of the country, a regional pattern gradually consolidated itself from 2006 onwards and has, so far, remained in place.2In 2006, the initial impacts of the PT’s policies, buoyed by positive international economic conditions, had already had an impact throughout the territory. Illustratively, Bolsa Família benefits comprised about 6% of total household income in the Northeast, 3% in the North, and 1.5% in the Southeast; see (<)a href='https://doi.org/10.1590/S0104-62762008000200001' target='_blank' rel='noreferrer noopener'(>)Soares and Terron (2008)(<)/a(>).

    If the northeast of the country has been loyal to Lula and the Workers’ Party since then, the north has been a more complicated case since Bolsonaro came to power. The President and his government have ramped up deforestation and expanded agribusiness across the Amazon—which covers most of Brazil’s northwest—and elsewhere. It’s a policy that has attracted global consternation but loyal support among the logging, mining, and farming industries. Deforestation in the Amazon was reduced by roughly two thirds during PT rule, but has since then almost doubled again to cover 13,000 square kilometers in 2021—and continues to accelerate.3Data from INPE. See also: https://www.theguardian.com/world/2022/may/07/record-after-record-brazils-amazon-deforestation-hits-april-high-nearly-double-previous-peak. The effects of Bolsonaro’s policies have been fatal, but the PT’s policies towards the region are themselves not without controversy. This is perhaps best encapsulated by the example of PT plans to build the Belo Monte dam in the state of Pará, which was bitterly resisted by affected indigenous and riverine communities. Electorally, this means the state has shifted from supporting the PT in 2010 and 2014 to supporting Bolsonaro in 2018, and it is currently split across its municipalities. As such, the Amazon and the wider north are very much at the crossroads of different pressures.

    New terrain

    If these standard maps of Brazil reveal a major cleft between north and south, they nonetheless skip over much of the texture and detail of Brazil’s political geography. Most significantly, their mode of representation ignores the differences that occur within regions and within states, as well as distorting population densities. Brazil’s election is won based on the percentage of the total vote rather than state-by-state victories, and analysis that distinguishes between larger and smaller conurbations is necessary. In Brazil, fourteen cities account for 20 percent of the vote—but just one percent of the territory. Similarly, 50 percent of voters are concentrated in just 8 percent of the territory. Looking at particular states, São Paulo accounts for about 3 percent of the country’s area, but 22 percent of the votes. The northern state of Amazonas, by contrast, spreads over 18 percent of the country’s area but yields just 2 percent of the vote.

    The cartograms below give a richer picture. Figure 2 maps the same two rounds of the 2018 election, plus the first round from 2022. It reveals a more accurate representation of the electoral map in so far as the mapped area is proportional to votes cast in each election.

    Figure 2: Electoral Brazil, cartogram of total votes for presidential candidates in Brazil, 2018 (first and second round) and 2022

    Author’s maps based on data from TSE.
    Notes: the area of states and municipalities is proportional to their share of total valid votes, i.e. equal areas represent the same number of total votes cast for all presidential candidates regardless of their hue. The color scheme is based on the percentage vote gap between the PT and Bolsonaro (positive/red if the PT is ahead).

    The main cities in each state are now clearly visible, with São Paulo in particular standing out. In 2022, it is the large, light pink area in the southeast—marginally won by the Workers’ Party—with a cordon of deeper red municipalities amidst a blueish sea. 

    What these finer-grained cartograms highlight is that there are significant intrastate divisions, both in the north and the south. The bellwether state of Minas Gerais is a clear example of this, reflecting its geographical position between the generally pro-Bolsonaro south and center-west and the pro-PT northeast. Capital cities in the north and northeast, made visible through their larger size in the cartograms, also stand out for often having a different color—and hence voting pattern—to the rest of their states. This calls attention to the political geography of the country’s towns and cities.

    Unlike in much of the global North in recent years, however, this is not simply a story of the biggest cities—the beneficiaries of globalization and with access to high-quality public services—voting for progressive candidates, and towns—often left behind and “deindustrialized”—backing the right. Brazil bucks this trend. Most large cities supported Bolsonaro in 2018, including a few in the PT-leaning northeast, both in the first and second rounds. Results for the first round this year were more mixed, and as Laura Carvalho and Pedro Abramovay have indicated, the PT did have a better showing in large cities this time.4See: https://piaui.folha.uol.com.br/eleicoes-2022/profecia-de-mano-brown. Nevertheless, with Bolsonaro holding on to most large cities of the south and Lula holding those of the north, the picture remains complicated. “Bolsonarismo,” then, is not a preserve of the hinterlands, nor is “Petismo” a metropolitan trend. Rather, large cities in Brazil are sites of polarization and tight margins, whilst Bolsonarismo is predominantly a medium-sized city phenomenon and Petismo is strongest in small towns. This plays out across the country, as the  following cartograms show.

    Reading the first round

    The Workers’ Party gained ground in the first-round election, albeit not to the extent that the polls anticipated. It has advanced in virtually all of the south, southeast and center-west, often to the tune of 30 percentage points (as in the city of São Paulo). At the same time, Bolsonaro has made substantial inroads in segments of the north and northeast. This is highlighted in Figure 3, which, comparing the first round of 2022 to the second round of 2018, shows changes in the vote gap.

    Figure 3: How 2022 is different: cartogram of changes to the vote gap between the PT and Bolsonaro, 2022 compared to second round of 2018

    Author’s maps based on data from TSE.
    Notes: the area is the same as in Figure 2. The color scheme is based on the variation of the percentage vote gap: it is positive/red if the PT has increased its lead or reduced its disadvantage, regardless of the absolute gap in either period.

    The broad pattern that emerges is that the PT has gained ground where it was weakest and ceded terrain where it was strongest. Regionally, of the 10 million additional votes the PT received (compared to the second round of 2018), 6 million came from the southeast and about 2 million from the south and center-west combined. As a result, the party has narrowed its losing gaps by between 18 and 26 percentage points in regions it is currently losing, and ceded some ground in the northeast, where it is winning.

    In general, the PT advanced in cities, particularly large ones, and stalled in towns. Across the country, Lula’s party moved ahead 3 percentage points in small towns, where it is currently at its strongest and leads by 24 points. It has trimmed its losses by 19 points in medium cities, where it holds its worst results, trailing by 9 points. The swing was even stronger in large cities, though, where the party went from a negative gap of 21 points in 2018 to a slightly positive lead of 2 points in the latest round. This pattern holds across the country. The PT’s losses (or rather the narrowing of their lead) have been concentrated almost exclusively in towns in the north and northeast. In the other three regions, the party has made similar inroads in large cities, hovering around a gain of 25 percentage points, but advanced much less in the towns and medium-sized cities of the south and center-west.

    Further research is needed to reveal why these shifts have occurred, but three hypotheses offer themselves. First, income-supporting benefits were recently hiked, and as they have a greater impact in small cities this might have drawn voters to Bolsonaro. Second, the PT might have taken for granted its regional stronghold of the northeast as it sought votes in the southeast, and Bolsonaro’s support for agribusiness may well have made him more resilient in the center-west, the country’s main agricultural frontier. Third, the pandemic. Under a denialist (mis)management of the disease, ripe with Bolsonaro militating against the use of masks, casting unfounded doubts on the vaccines, and even proffering scoffing remarks towards people’s suffering, the pandemic has claimed nearly 700,000 lives in Brazil and led to some of the highest mortality rates in the world, at about 320 per 100,000 inhabitants. Arguably this helped tilt the overall balance of votes towards the PT, but perhaps particularly so in large cities that might have borne the greatest brunt of the disease. 

    Despite these shifts in 2022, there is an enduring divide between town and city, explored through the cartograms below. They demonstrate three salient points:

    1. Bolsonarismo is fundamentally a medium-sized city phenomenon

    The maps in figure 4 below plot the proportion of Bolsonaro’s votes: the darker the blue, the higher the vote share. Immediately apparent is the lighter tones for the northeast of the country; the area constitutes 28 percent of the electorate but just 16 percent of Bolsonaro’s vote. Large cities also have a lighter hue, reflecting their polarization. In the southeast, for example, the three major cities—São Paulo, Rio de Janeiro to its east, and the capital of Minas Gerais, Belo Horizonte, slightly to the north of the two—have lighter hues than their surroundings.

    Figure 4: Bolsonaro’s Brazil, cartogram of votes for Bolsonaro in Brazil, 2018 (first and second round) and 2022

    Source: prepared by the author based on data from TSE.
    Notes: the area of states and municipalities is proportional to their share of total votes cast for Bolsonaro, i.e. equal areas represent the same number of total votes for Bolsonaro regardless of their hue. The color scheme is based on the vote share for Bolsonaro.

    The fine lines on these cartograms have the value of distinguishing between small, medium and large conurbations. Focusing on the darkest shades of blue, it is apparent that Bolsonaro’s support is greatest in medium-sized cities, which represent about 20 percent of the total electorate. This has been the case for all three elections depicted above; in every region but the northeast, Bolsonaro’s share of the vote has exceeded the PT’s by double digits, often with a gap of 20 or 30 percentage points. 

    2. The PT’s stronghold is small towns

    Figure 5 maps the PT’s share of the vote since 2018. The deep red of the northeast represents Lula’s stronghold there, as it represents between 38 and 47 percent of total votes for the party. Nevertheless, the state of São Paulo has been the largest absolute source of votes for the PT, both in the second round of 2018 and in the first of 2022—despite Bolsonaro ultimately winning there. Of the 57.3 million votes Lula received in 2022, 10.5 million came from the state of São Paulo, followed by 5.9 million from Bahia in the northeast, and 5.8 million from Minas Gerais, in the southeast but bordering the Bahia. In the city of São Paulo itself, the PT went from trailing by twenty-one points in 2018 to leading by nine in 2022, with Lula ultimately receiving 3.3 million votes there, compared to Bolsonaro’s 2.6 million.

    Figure 5: The PT’s Brazil, cartogram of votes for PT presidential candidates in Brazil, 2018 (first and second round) and 2022

    Source: prepared by the author based on data from TSE.
    Notes: the area of states and municipalities is proportional to their share of total votes cast for the PT, i.e. equal areas represent the same number of total votes for the PT regardless of their hue. The color scheme is based on the vote share for the PT.

    The novel element here is that these maps show that it is neither big nor medium-sized cities that constitute the PT’s most reliable base, but small towns. Indeed, every time the PT has gone to an election against Bolsonaro, these small towns across the country have been its electoral bastion, where it has held the highest leads or sustained the smallest losses. In the first round of 2022, this meant a total of excess votes upwards of 50 percentage points in the northeast and a minor lead of one point in the small towns of the southeast.

    3. Major cities are polarized and occasionally flip the state-wide vote

    If large towns are principally the domain of Bolsonaro and smaller towns overall vote for Lula, what of the biggest cities in Brazil? 35 percent of the electorate live in big cities, the largest of which by far is São Paulo, followed by Rio de Janeiro, Brasilia, and then Salvador in the state of Bahia and Belo Horizonte in Minas Gerais. 

    What is noticeable from these maps is that these cities sometimes vote against the rest of the state that surrounds them. This can be seen in Figure 2 above, where in all three rounds, small islands of blue can be identified amid seas of red, or vice-versa. The state of Amazonas in the Northwest of the country is striking: a large, strongly pro-Bolsonaro city—the capital of Manaus—stands out in an otherwise consistent patch of red. The intra-state division revealed here may well be due to the different policies of the PT and Bolsonaro towards the Amazon, which sprawls across most of northwest Brazil. It is nonetheless surprising that Manaus, the largest city in the Amazon, favored Bolsonaro despite having twice suffered the collapse of its healthcare system during the pandemic when hospitals were above capacity, oxygen supplies ran out, and mass graves were required to bury the dead. 

    This means that in states that generally vote for Bolsonaro, medium cities often exacerbate region-wide tendencies and small towns attenuate them; in pro-PT areas, by contrast, the reverse is true. When the voting difference between small towns and medium cities is large enough to make them straddle the political divide, large cities might fall on either side—eventually breaking the broader regional or state-wide tendency. Which is to say, the town and city divide in Brazil is not simply a matter of metropolises versus villages; rather, it works in and through regional dynamics and the urban network.

    Reading the regional divide

    On the eve of the second-round election that will decide the country’s fate, it is worth asking: what accounts for Brazil’s recent voting patterns and why does the country tend to buck the global trend with regard to electoral politics, insofar as its biggest cities can’t be relied upon to vote progressively? 

    An obvious factor contributing to this polarization is the extreme inequality of Brazilian cities. Where small towns in Brazil are certainly marked by deprivation, the very rich and the very poor there less commonly live cheek by jowl. In São Paulo, by contrast, lavish apartment blocks abut shantytowns; in Rio, crumbling favelas with little access to formal services overlook some of the wealthiest neighborhoods. Inequality is by no means unique to Brazil, but it is unlike European cities, for example, where public services are more evenly distributed among urban areas. Cities in the US, by contrast, are more commonly subject to the postcode lottery experienced in Brazil, but sanitation and basic infrastructure are nevertheless generally fixtures throughout the country. This cannot be said for the favelas of shantytowns of Brazil, even in its largest cities, where paved roads, modern sewage, and formal access to electricity remain an aspiration rather than a reality. 

    Large cities in Brazil also benefit from substantial migratory flows but, unlike in the global North, migration is mostly internal, comprising Brazilians from small towns moving across the country. Concerns over security add further fuel to the urban conflict at the heart of these spaces. In this highly contested social space, what emerges is not the open cosmopolitanism that often characterizes the biggest cities of the global North, but rather an entrenched polarization gridlocking individuals into a bitter struggle over deeply constrained processes of social mobility. 

    Overhauling this situation is as urgent as it is likely to be difficult. Bolsonaro’s platform is divisive and exclusionary to its core, so should he hold onto power, there is little hope from that quarter. Lula’s campaign has meanwhile focussed on reviving the conciliatory tone of his former government, but has been lacking in concrete policy proposals. Should he win, he will face a right-wing legislature, no commodities boom to relax spending constraints, and tougher domestic economic conditions with high inflation and public and private debt levels. Bringing towns and cities together in an inclusive development strategy, under these circumstances, will be no mean feat.
  2. An Introduction

    Comments Off on An Introduction

    This is the first edition of The Polycrisis newsletter, written by Kate Mackenzie and Tim Sahay. Subscribe here to get it in your inbox.

    What crisis?

    A year ago, one might be forgiven for thinking there was a moment of relative calm for wealthy countries: a year of vaccinations had made the pandemic less acute, inflation hadn’t yet provoked interest rate hikes, and labor markets were strong. In the climate world, the energy transition was progressing and, after years of struggle in the UN climate diplomacy track, there was even some sign from rich countries that the poorest and most vulnerable states might be compensated for the loss and damage from climate-fueled disasters. 

    In reality, all was not well. As anticipated early in the pandemic, dozens of low-income and smaller middle-income countries were continuing to grind towards sovereign debt crises provoked by a sudden drop in foreign income and climbing healthcare costs. Creditors (the wealthy Paris Club countries, multilateral banks, bondholders, and China) had all failed to head off this debt crisis. Meanwhile, vaccines remained unavailable to many people in the poorest countries. Energy costs were climbing. 

    Then Russia’s invasion of Ukraine, and historic coordinated economic sanctions by Western governments, made everything much worse—in ways that even the world’s richest countries couldn’t avoid. 

    Energy costs in Europe were already high going into the winter of 2021. This was driven in part by the curtailment of China’s coal-fired generation leading to more demand for imported gas. In 2022, it’s spilled over into other countries: Europe and richer east Asia countries are now in a bidding war for limited gas supplies. Others have been priced out of the market entirely. Pakistan had rolling weeks-long power outages; while gas rationing by Bangladesh was not enough to prevent a grid collapse earlier this month, leaving over a hundred million people to grapple with blackouts. 

    Last week, the IMF forecasted slowing global growth in 2023, and a “material worsening” of world financial stability. Havoc in the real world is pushing a financial crisis in wealthy economies, which in turn will exacerbate real suffering, as food and energy imports are pushed further out of reach of countries struggling to afford US-dollar denominated commodities. 

    In the background to all of this are increasingly frequent and severe weather disasters caused by a warming climate—and the urgent and persistent imperative to eliminate greenhouse gas emissions. Nature does not stay at home. 

    The climate crisis cannot be solved without a thorough reckoning of the relations between the global South and the global North. While the US enjoys primacy in the global financial architecture, and other wealthy countries have outsized influence, developing countries are not without agency. Middle-income powers were either excluded from or unenthusiastic about the G7’s early coordinated sanctions on Russia. They are now using strategic non-alignment—playing one bloc off another—to secure resources and industries, such as transition minerals and chips.

    Global North countries seem unprepared for the economic and geopolitical agency being exercised by the big middle-income countries. Nor are they responding to smaller and poorer nations. The IMF’s new long term facility, the Resilience and Sustainability Trust, is meagre next to the needs of its target recipients: vulnerable countries battling with the pandemic and climate change. But those countries, too, are finding ways to be heard. In September, Barbados PM and recent chair of the World Bank/IMF Development Committee Mia Mottley released the “Bridgetown Agenda,” calling for debt reform, rechanneling of SDRs, and multilateral lending. (Mottley was the subject of a lengthy New York Times profile on how she obtained IMF support in restructuring the tiny country’s US dollar bonds to account for hurricane losses, while avoiding the IMF’s traditional austerity prescription.)

    The Agenda calls for “urgent and decisive action” in the face of an “unprecedented combination of crises,” and will probably attract great interest at COP27 in Egypt next month. But it will have to contend with the vexed question of the $100 billion in climate finance previously promised for the global South, and the thorny issue of loss and damage. India and Indonesia—developing countries that have weathered recent shocks with relative resilience—are taking the helm at the G20. But the possibility of even modest progress in that forum is slim, with geopolitical tensions with Russia making the issuance of a communiqué unlikely.

    Increasingly widespread appeals to the term “polycrisis” are not a get-out-of-of-jail-free card for powerful interests, who must make principled decisions amidst systemic crises. None of this will sort itself out. 

    The Polycrisis aims to untangle the Gordian Knot of security, climate, economic, and political dilemmas. Stay connected here, forward this first edition to three new readers to help us grow our audience, and write to us to continue the conversation.

    Postscript: Why “The Polycrisis ?”

    Over the last year, historian Adam Tooze popularized the term “polycrisis.” Previously deployed by Jean-Claude Juncker in to describe the eurozone-Brexit-climate-refugee crises in 2016, and originally attributed to French complexity theorist Edgar Morin, Tooze explored it again in June with his crisis pictures of overlapping emergencies—pandemic, sovereign debt, inflation, GOP risk, hunger—in which the whole becomes more dangerous than the sum of the parts.

    We also want to acknowledge a debt to economic analyst Nathan Tankus, who articulated the interconnectedness that we want to track in our project, pointing out that his newsletter was called Notes on the Crises, “for the simple reason that this is not the only crisis we will encounter over the next several decades.”

    Our goal is to explore those connections, and to identify and amplify others who are doing the same.

    Email us to join the discussion.

  3. Africa’s Century of Growth?

    Comments Off on Africa’s Century of Growth?

    The Wealth and Poverty of African States
    By Morten Jerven
    Cambridge University Press, 2022

    On May 1, 2014, Nigeria’s then-president, Goodluck Jonathan, addressed a crowd of workers in the country’s capital Abuja.  He declared that “the challenge of the country is not poverty, but redistribution of wealth.”1“Nigeria is Not a Poor Nation, Says Jonathan,” (<)em(>)Vanguard (<)/em(>)(May 1, 2014): https://www.vanguardngr.com/2014/05/nigeria-poor-nation-says-jonathan/ The prompt for his comment was a report issued only a few days prior, which labeled Nigeria, Africa’s most populous country, as one of only five nations that are home to two-thirds of the world’s population living in extreme poverty.2World Bank Group, “Prosperity for All: Ending Extreme Poverty,” (<)em(>)Notes for the World Bank Group Spring Meetings (<)/em(>)2014: https://openknowledge.worldbank.org/bitstream/handle/10986/17701/32853ProsperityForAll.pdf?sequence=4 Rejecting the categorization of Nigeria as a poor country, President Jonathan pointed to the country’s Gross Domestic Production (GDP), which he declared was “over half a trillion dollars.” Moreover, the economy, he maintained, was “growing at close to 7 percent.”3“Nigeria is Not a Poor Nation, Says Jonathan,” (<)em(>)Vanguard (<)/em(>)(May 1, 2014): https://www.vanguardngr.com/2014/05/nigeria-poor-nation-says-jonathan/

    It was only a week before the president’s address that the official figure for Nigeria’s GDP had been significantly revised. The first reexamination of the structure of the Nigerian economy since 1990 showed an increase in the country’s 2013 GDP by 89 percent. Scholars were surprised by the dramatic growth in the banking and telecommunications sectors and the significant decline in the relative size of the hydrocarbon sectors.4Javier Blas and William Wallis, “Nigeria Almost Doubles GDP in Recalculation,” (<)em(>)The Financial Times (<)/em(>)(April 7, 2014): https://www.ft.com/content/70b594fe-bd94-11e3-a5ba-00144feabdc0.

    With little outside recognition, the Nigerian economy had transformed itself in the space of a couple of decades. Once dependent on oil exports, by 2014 the economy had been diversified and was growing rapidly. This was a stark shift from the economy described by IMF observers in 1999, who wrote that “Nigeria’s economic and social development remains far below even the minimum expectations of the population.”5IMF, “Memorandum on Economic and Financial Policies of the Federal Government of Nigeria for 1999,” (<)em(>)IMF (<)/em(>)(February 22, 1999): https://www.imf.org/external/NP/LOI/1999/022299.HTM. In that year, half of Nigeria’s population lived in absolute poverty, the life expectancy was only fifty-two years, and infant mortality was eighty-four out of every 1,000 live births.6Ibid

    What more recent calculations of the economy reveal, however, is that Nigeria has not suffered from a lack of long-run growth as many scholars of African development had long assumed. Rather, the problem is that growth has not significantly reduced the rates of poverty—today, over 40 percent of Nigeria’s population lives below the  extreme poverty line.7Oladeinde Olawoyin, “Number of Poor People in Nigeria to Reach 95 Million in 2022—World Bank,” (<)em(>)Premium Times (<)/em(>)(March 30, 2022): https://www.premiumtimesng.com/business/business-news/520849-number-of-poor-people-in-nigeria-to-reach-95-million-in-2022-world-bank.html.

    Reconceptualizing the African tragedy

    Since independence, scholars across the political spectrum have long debated the reasons for Africa’s abnormally slow growth.8Frantz Fanon, (<)em(>)Wretched of the Earth (<)/em(>)(New York, NY: Grove Press, 2021); Walter Rodney, (<)em(>)How Europe Underdeveloped Africa (<)/em(>)(New York, NY: Verso, 2018); Giovanni Arrighi and John S. Saul, (<)em(>)Essays on the Political Economy of Africa (<)/em(>)(New York, NY: Monthly Review Press, 1973); Peter T. Bauer, (<)em(>)West African Trade: A Study of Competition, Oligopoly and Monopoly in A Changing Economy (<)/em(>)(London, UK: Cambridge University Press, 1954); Robert H. Bates, (<)em(>)Markets and States in Tropical Africa: The Political Basis of Agricultural Policies (<)/em(>)(Berkeley, CA: University of California Press, 2014); Paul Collier, (<)em(>)The Bottom Billion: Why the Poorest Countries Are Failing and What Can Be Done About It (<)/em(>)(Oxford, UK: Oxford University Press, 2008). Much of that writing has been characterized by pessimism,9Saidiya Hartman, (<)em(>)Lose Your Mother (<)/em(>)(New York, NY: Macmillan Press, 2006); Alden Young, “How Black America Fell Out of Love with Africa,” (<)em(>)Noema.com (<)/em(>)(March 8, 2022): https://www.noemamag.com/article-topic/geopolitics-globalization/ but nearly two decades ago, economic historians formed the African Economic History Network in order to challenge the poor quality of data used in narratives about Africa’s economic past, as well as to center Africa’s position in the discipline of economic history. Building on the efforts of this network, Morten Jerven’s new book begins with an assertion that startles our notions of racial hierarchy and global economic history:10The first meeting of the African Economic History Network took place in 2005 at the London School of Economics. It was organized under auspices of Gareth Austin. A. G. Hopkins, “The New Economic History of Africa,” (<)em(>)Journal of African History (<)/em(>)50:2 (2009): 155-177. in the long run, Africa’s rate of economic growth is unexceptional. He notes:

    The aggregate pattern is a long period of expansion, sometimes dating from the 1890s to the 1970s. This gave way to widespread failure and decline in the 1980s, followed by two decades of expansion since the late 1990s.11Jerven, “The Wealth and Poverty of African States,” p. xii

    The statement stands in stark contradiction to decades of research on African economies, which have been devoted to explaining a persisting failure of economic growth.  Jerven goes on to state that:

    It is true that on average African economies grew more slowly than other economies from the 1960s until the mid-1990s, but that is true only if you take the average of that whole period and let it end in the mid-1990s. It is not true that African economies grew more slowly on average in the 1950s, the 1960s, the 1970s, and the 2000s.12Jerven, p. 25

    What, then, is the source of the growth-resistant narrative? One stylized fact stands behind the perspective that African economies possess structural barriers to growth: during the 1980s and most of the 1990s, African economies grew at far lower rates than the rest of the world.13Ibid.

    Yet, as Morten Jerven has argued brilliantly since his 2013 book Poor Numbers, the average growth figures from the 1980s and 1990s were overemphasized and erroneously extrapolated from in order to breathe new life into the colonial idea that Africa is an unchanging and stagnant continent mired in poverty.14Morten Jerven, (<)em(>)Poor Numbers: How We Are Misled by African Development Statistics and What to Do About It? (<)/em(>)(Cornell University Press, 2013).In Poor Numbers, Jerven unveiled the ways that GDP statistics upon which growth rates were calculated were skewed. In retrospect, the troughs of the 1980s look too deep, and the accelerations of the late 1990s and the African Renaissance of the early 2000s are too fast. Jerven’s book was an indictment of armchair economists and political scientists who performed statistical analyses based on figures tabulated in places like the Penn World Tables, Angus Maddison Index, or the World Development Institute to make causal inferences about why, for instance, Japan is so much richer than Ethiopia. During the first decade of the twenty-first century, these methods led to a revival of work examining Africa’s economic past within North American economics departments.15A. G. Hopkins, “The New Economic History of Africa,” (<)em(>)The Journal of African History (<)/em(>)50:2 (2009): 155-177. The examinations resulted in a series of widely cited and highly influential papers about the long-duration causes of Africa’s relative poverty, which emphasized the inadequacies of African social, cultural, and political institutions. Some of the most famous papers were produced by Daron Acemoglu, Simon Johnson, James Robinson, Nathan Nunn and Leonard Wantchekon.16Daron Acemoglu, Simon Johnson, and James A. Robinson, “The Colonial Origins of Comparative Development: An Empirical Investigation,” (<)em(>)American Economic Review (<)/em(>)91:5 (2001), 1369-1401; Nathan Nunn and Leonard Wantchekon, “The Slave Trade and the Origins of Mistrust in Africa,” (<)em(>)American Economic Review (<)/em(>)101:7 (2011): 3221-3252. Jerven’s adviser, Gareth Austin, argued that this literature, which defined the “new African economic history” and accompanied the rise of causal inference as a method of political science, suffered from what he termed “the compression of history.”17Gareth Austin, “The reversal of fortune thesis and the compression of history: Perspectives from African and Comparative Economic History,” (<)em(>)Journal of International Development (<)/em(>)20:8 (2008): 996-1027. In particular, Austin argued that by not differentiating between different periods of history, stories of causation become oversimplified.

    The image of African poverty has proven so enduring in part thanks to the depths of what Giovanni Arrighi termed “the African Tragedy.”18Giovanni Arrighi, “The African Crisis,” (<)em(>)New Left Review (<)/em(>)15 (2002): 5-36; Colin Leys, “Confronting the African Tragedy,” (<)em(>)New Left Review (<)/em(>)1/204 (1994): 33-47. For Arrighi, a few descriptive statistics captured the magnitude of the Sub-Saharan African disaster in the period between 1975 and 1999. For instance, he wrote that in 1975 the Gross National Product (GNP) per capita of Sub-Saharan Africa stood at 17.6 percent of “world” per capita GNP; in 1999 it had fallen to only 10.5 percent. While aggregate national economic income statistics told part of the story, Arrighi also demonstrated that health, mortality, and adult literacy all declined at similarly steep rates in comparison with other developing countries. At the turn of the twentieth century, this contributed to a sentiment captured by The Economist in 2000, when a front cover declared that Africa truly was “The Hopeless Continent.”19“The Hopeless Continent,” (<)em(>)The Economist (<)/em(>)May 13, 2000.

    By 2011, however, The Economist had joined the chorus proclaiming that Africa was “rising,” now re-dubbing Africa “the hopeful continent.”20“Africa Rising,” (<)em(>)The Economist (<)/em(>)December 3, 2011. Writing breathlessly, the magazine noted that, “over the past decade six of the world’s ten fastest-growing countries were African. In eight of the past ten years, Africa has grown faster than East Asia, including Japan.”21“Africa Rising,” (<)em(>)The Economist (<)/em(>)December 3, 2011. https://www.economist.com/leaders/2011/12/03/africa-rising. Equally important, African economies’ rates of growth did not decline with the Global Financial Crisis of 2008. Indeed, The Economist’s lead writers remarked approvingly that in 2011 and 2012, African economies were expected to continue growing at roughly 6 percent a year—about the same as those of emerging Asian economies. According to World Bank statistics, the first two decades of the twenty-first century saw African economies grow at an average of 4.35 percent; well above the global average of roughly 3 percent for the same twenty-year span.22Data, (<)em(>)The World Bank (<)/em(>)“GDP Growth (annual %), 2000-2019,” https://data.worldbank.org/indicator/NY.GDP.MKTP.KD.ZG?end=2019&start=2000. An entire cottage industry has emerged to explain Africa’s economic renaissance. Much of the analysis has centered on the ability of African states to convert income from the commodity boom—caused by rising Asian demand, especially from China—into sustained development. This has enabled the development of labor-intensive, export-oriented industrialization in several African countries, but questions remain about whether this industrialization can be sustained in countries like Ethiopia, which erupted into civil war in November 2020.23Ewout Frankema and Marlous van Waijenburg, “Africa Rising? A Historical Perspective,” (<)em(>)African Affairs (<)/em(>)117/469 (2018): 543-568; Declan Walsh and Abdi Latif Dahir, “Why is Ethiopia at War with Itself?” (<)em(>)New York Times (<)/em(>)(March 16, 2022): https://www.nytimes.com/article/ethiopia-tigray-conflict-explained.html.

    In The Wealth and Poverty of African States, Jerven raises an alternative possibility. Rather than a deviation, he posits that the African growth rates in the present century show a reversion to long-standing growth trends. Drawing on original time-series data for several countries in British Africa, including the Gold Coast (Ghana), Sierra Leone, Kenya, Nyasaland (Malawi), Tanganyika (Tanzania), and Uganda, Jerven and his colleagues challenge the standard narratives about African economic development. Since “the data for calculating GDP for African countries before 1950 is scarce,”24Jerven, (<)em(>)The Wealth and Poverty of African States (<)/em(>)p. 68. with little available beyond the British government’s colonial blue books, he posits that “the most prudent course of action might be to plead ignorance regarding population growth and agricultural productivity.”25Jerven, (<)em(>)The Wealth and Poverty of African States (<)/em(>)p. 73 and Jerven, (<)em(>)Poor Numbers.(<)/em(>)

    Instead, Jerven and his colleagues use the fairly reliable data that exists in government documents for exports, imports, government expenditures and revenue to create a consistent data set spanning the entire twentieth century. As Jerven readily acknowledges, this limits his study to the growth rate in formal markets and excludes the huge informal sector, where the vast majority of economic activity is estimated to take place in many African societies. Despite sparse historical data and the need to make key assumptions about the productivity of the agricultural sector and the quantity of food consumption, Jerven demonstrates that Africa was by no means an economically stagnant continent in the twentieth century. Rather, there was sustained and widespread growth during the colonial and early independence periods ranging from the 1890s to the 1970s. There was indeed a sharp interruption to this growth during the 1980s, but growth resumed in the 1990s, as is the case today. 

    Accounting for poverty

    The outstanding challenge to Jerven’s narrative of continuous economic growth in Sub-Saharan Africa is the persistence of African poverty. Comparative studies between Sub-Saharan African workers and peasants and their peers in Asia have found that the former appear relatively prosperous from 1940 to 1970, yet the picture changes thereafter. As Francois Bourguignon and Christian Morrisson have pointed out, the twentieth century saw dramatic changes to the patterns of global poverty that had dominated the nineteenth century:

    Europe’s ascending supremacy from 1820 until 1950 was checked by the economic rise of the Asian dragons and the relative decline in the European population. At the other end of the spectrum, the dominant change has been the continuously increasing share of Africa among the world’s poor, an evolution that accelerated sharply during the twentieth century. Because of Africa’s rapid population growth and its lower than average economic growth, this region’s share among the world’s poorest 60 percent increased from 8 percent at the end of the nineteenth century to 17.5 percent in 1992.26F. Bourguignon and C. Morrisson, “Inequality Among World Citizens: 1820-1992,” (<)em(>)American Economic Review (<)/em(>)92:4 (2002): 739.

    Though this shift in concentrated poverty from Asia to Africa in the aftermath of the Second World War is left unaddressed in Jerven’s book, it nonetheless haunts his work. Jerven makes use of the 2011 real wage data set produced by Frankema and van Waijenburg to show that wages in African urban areas grew steadily and sometimes quite rapidly from the 1880s until the 1960s, particularly in the non-settler colonies of West Africa and Uganda.27E. Frankema and M. van Waijenburg, “African Real Wages in Asian Perspective, 1880-1940,” (<)em(>)Working Paper No. 2 Center for Global Economic History, (<)/em(>)Utrecht University (2011). He concludes by noting that “corroborating evidence indicates that the incidence of poverty was not a typical African phenomenon five decades ago.”28Jerven, (<)em(>)The Wealth and Poverty of African States (<)/em(>)p. 143. If poverty was a common phenomena during the colonial period, it raises serious questions about the efficacy of the international aid enterprise, which, beginning in the 1970s, made the elimination of poverty its primary policy goal.

    Such an admission makes it all the more pressing to question what did in fact happen in the last decades of the late twentieth century. Drawing on Latin American history, Robert Bates, John H. Coatsworth, and Jeffrey G. Williamson have argued that Africa’s “lost decades” may be akin to the political instability that marred Latin America in the decades immediately following European colonialism. Such a thesis implies that a resumption of growth and relative political stability should have been expected in Africa in the early decades of the twenty-first century.29Robert Bates, John H. Coatsworth and Jeffrey G. Williamson, “The Lost Decades: Postindependence Performance in Latin America and Africa,” (<)em(>)The(<)/em(>) (<)em(>)Journal of Economic History (<)/em(>)67:4 (2007): 917-943. Recent data from Ghana appears to justify the theory, insofar as it shows that the sharp rise in rates of African poverty during the 1980s and early 1990s was a temporary phenomenon, and not the beginning of a persistent trend. For instance, in 1991 about 47 percent of Ghanaians lived in extreme poverty, but that number declined to 25 percent in 2005. Yet, as Frankema and van Waijenburg underscore, though there has been a drop in the rate of poverty, Africa is still far behind China. While African economies may have a long track record of growth, the rise in living standards in the post-colonial era has been far too slow.  Without a substantial change in the structure of African economies, poverty seems inevitable.30Ewout Frankema and Marlous van Waijenburg, “Africa Rising? A Historical Perspective,” (<)em(>)African Affairs (<)/em(>)117/469 (2018): 547. Writing two decades ago, Giovanni Arrighi asserted that the tragedy which befell African societies in the 1980s was the result of a dramatic shift in the global economy. In the 1960s and early 1970s, Africa had enjoyed favorable terms of trade, allowing governments to make large investments in their human capital and import-substitution industries. Having made use of the cheap capital available from Western banks, these states soon found themselves suddenly vulnerable to rising interest rates in the United States, leading to a surge in the cost of their debt. The debt crisis that ensued led to structural adjustment policies which in turn greatly curtailed state capacity. All the while, the intensification of the Cold War sparked prolonged conflicts in southern Africa and the Horn of Africa throughout the 1980s.31Giovanni Arrighi, “The African Crisis,” (<)em(>)New Left Review (<)/em(>)15 (2002): 5-36. See also Colin Leys, “Confronting the African Tragedy,” (<)em(>)New Left Review (<)/em(>)1/204 (1994): 21-22.

    After more than two decades of growth, Africa continues to face a similar problem. Rising interest rates in the United States and growing tensions with China and Russia raise the prospect that African growth will once again be curtailed. The hope, however, is that African economic growth has significantly decoupled from that of developed economies since the crisis of 2008. The maturation of this increasing financial independence can be seen from the rise of Pan-African banks across the continent, and particularly in West Africa. As Hannah Appel warns, however, it is still too early to know whether the rise of Pan-African banks really breaks the mechanisms of dollar dependence that led to Africa’s lost decades in the 1980s.32Hannah Appel, “Pan-African Capital? Banks, Currencies, and Imperial Power,” Working Paper (2022). We may be entering a period where the growing cost of dollar-denominated capital will force African countries to embark on austerity programs of similar severity to those in the 1980s, which had ruinous results for African societies and long-term state capacity. The hope is that the resilience of African economies and capital markets have improved, making them less vulnerable to a period of US-led financial restriction.  

    The limits of growth

    Though it represents an impressive contribution to the study of African economic history, Jerven’s book nevertheless leaves certain key questions unexplored. Perhaps the weakest element of the book is that its time series begin in the 1890s, roughly the decade in which Britain and France consolidated their control over the continent. This allows Jerven to emphasize what he sees as a weak relationship between domestic policy and economic growth. But while the policy regime a particular country adopts may not have dramatic impacts on its long-term growth rate, it does have serious implications for the domestic distribution of income. The pathbreaking work of Kevan Harris has shown that countries like the Islamic Republic of Iran have reduced income inequality through social welfare measures even while enduring three decades of negative growth rates due to sanctions.33Kevan Harris, (<)em(>)A Social Revolution: Politics and the Welfare State in Iran (<)/em(>)(Berkeley, CA: University of California Press, 2017). Jerven has much to say about economic growth, but little to say about the lived experience of that growth.

    Discussing the wealth of Nigeria, former President Goodluck Jonathan concluded, “If you talk about ownership of private jets, Nigeria will be among the first ten countries, yet they are saying that Nigeria is among the five poorest countries.”34“Nigeria is Not a Poor Nation, Says Jonathan,” (<)em(>)Vanguard (<)/em(>)(May 1, 2014): https://www.vanguardngr.com/2014/05/nigeria-poor-nation-says-jonathan/ The statement underlines the crux of the real challenge facing African economies—the African continent has the second highest levels of inequality in the world, behind only Latin America. The top 10 percent of the population owns 78 percent of all assets across the continent.35Philip Nel, “Inequality in Africa,” in ed. Tony Binns et al, (<)em(>)The Routledge Handbook of African Development (<)/em(>)(London, UK: Routledge, 2018), 106; Branko Milanovic, “Is Inequality in Africa Really Different?” (<)em(>)Available at SSRN 636588(<)/em(>) (2003).

    Not all growth is equal. On its own, GDP growth does not improve the living standards and experiences of workers. Beyond GDP, domestic policy plays a decisive role in facilitating job creation in productive sectors, ensuring adequate compensation, and offsetting living costs through welfare measures. In determining who benefits from growth, and how much, policy regimes—and the politics that put them into place—still have an enormous role to play. 

  4. The Finance Gap

    Comments Off on The Finance Gap

    UN Secretary General Antonio Guterres’s foreword to a 2021 UN Inter-agency Task Force on Financing for Development report exhibits a prevalent piece of common sense in sustainable development circles: 

    Financing for sustainable development is at a crossroads. Either we close the yawning gap between political ambition and development financing, or we will fail to deliver the Sustainable Development Goals (SDGs) by the deadline of 2030. 

    The question of how to bridge this “yawning gap” between the aims of sustainable development and available financial resources, however, can be solved by only one method, according to the full report: “a boost in private investment.” This formula—the existence of a “financing gap” and the subsequent need to expand private investment—is an increasingly prominent focus in the development world, across a range of areas.

    Though he is a very prominent voice, Guterres is far from alone in making claims like these. This emphasis on private financing is the first premise of what Daniela Gabor calls the “Wall Street Consensus”—the growing agreement among development agencies about the need to “escort” private capital into development projects through various forms of “derisking.”

    At preparatory discussions for the post-2015 Sustainable Development Goals, policymakers identified large financing needs, and a concomitant need to “un[lock] the transformative potential of people and the private sector” in order to address that gap. This was the basis for the World Bank and other Multilateral Development Banks to lay out what was initially called the “Billions to Trillions” agenda following a 2015 meeting in Addis Ababa. The agenda is based around the core principle that meeting the SDGs will require “intelligent development finance… that can be used strategically to unlock, leverage and catalyze private flows and domestic resources.” This will require “using the ‘billions’ in ODA and in available development resources to attract, leverage, and mobilize ‘trillions’ in investments of all kinds: public and private, national and global, in both capital and capacity.” Development aid, in this context, needs to be targeted at the so-called crowding in of other sources of financing. The Bank’s new slogan is “Maximizing Finance for Development” (MF4D), indicating the need to marshal private investment to help close the development gap. 

    The invocation of the term “finance gap,” in identical or very similar terms to those seen in Guterres’s foreword, has a much longer history than we often assume. And its invocation often is an anodyne or depoliticizing way to describe a systemic tendency towards uneven development and the true structural obstacles that tendency poses for equitable development. Indeed, the sheer persistence of the finance gap as a frame reflects the structural constraints with which development projects have often grappled. It is by studying the longer history of the finance gap that its political dimension is most clearly revealed—particularly the subset of development practice aimed at expanding access to formal credit.

    In the sphere of development, discussion of the finance gap tends to paper over the political dynamics of financial resources—that is, who controls them, and what this means for fiscal and monetary policy outside of the metropolitan centers. For states and multilateral institutions confronting these structural constraints while needing to mitigate the worst social and ecological consequences of uneven development, an appeal to mobilizing private finance has often appeared as the path of least resistance. But those sought-after flows of finance capital have usually proved to be unattainable.

    A colonial prelude

    The finance gap long precedes the Wall Street Consensus. In 1951, a British colonial official, writing on a proposed scheme to establish credit cooperatives for African borrowers in Kenya, noted that:

    These societies are not likely, in the near future, to attract many deposits either from members or non-members. They will therefore have to depend on other sources for their working capital either government or commercial banks. No government has sufficient funds to finance many peasant cultivators and in the end, finance will have to come through the commercial banks.

    Reference to the government’s lack of funds, as well as the impetus to develop private and commercial finance is clearly echoed in a statement like Guterres’s. It’s a statement that reflects the specific context of late-colonial Kenya. African agriculture in Kenya had historically been explicitly and directly underdeveloped. With the advent of white settlement in the first decades of the twentieth century, land and agricultural policy increasingly reserved access to finance and markets for settlers, and sought to produce a population of cheap African laborers. As Abreena Manji notes, in this sense, “Kenyan land policy was… racialized at its inception.” 

    There were tentative efforts to change entwined systems of credit allocation and property relations so as to support African agriculture as early as the 1930s. Facing the effects of the Great Depression, the colonial state sought to both expand its fiscal base and contain growing political threats. Proposals in the 1930s and 1940s foundered, but efforts at reform were ramped up in the aftermath of the Mau Mau rebellion—the armed revolt led by the Kenya Land and Freedom Army, which was brutally repressed by the colonial state. 

    The colonial government appointed Roger Swynnerton, Assistant Director of Agriculture in Kenya to develop a scheme for agricultural development in late 1953. The resulting report—commonly referred to as the Swynnerton Plan—marked a significant shift towards unambiguously encouraging the development of African agriculture.

    Swynnerton’s proposal aimed to do this by mobilizing private lending for farming. This meant changing the way that African farmers held land so as to make it more compatible with existing financial systems. The shift was explicitly justified in terms that are echoed very closely in statements like Guterres’s above: Swynnerton argued that it was impossible to mobilize sufficient resources from the public sector alone. Some lending from public sources was necessary, but “were each farmer with a registered title to his land to borrow up to [£300] against the security of his title, ultimately borrowing would greatly exceed the resources of Kenya.” 

    The solution mainly consisted in encouraging the much wider adoption of formal land titling. The explicit purpose of this was to encourage much greater access to commercial credit for African borrowers: “If Africans are to develop their lands to their full potential they will require much greater access to finance and if they achieve titles to their land in economic units, much greater facilities should be made available to them for borrowing against the security of their land.” The plan was expressly intended to create a small middle class of property-owning African farmers capable of employing wage labor and, crucially, accessing productive credit.

    The affinity with the finance gap here is telling. Here was, first and foremost, a set of expressly conservative responses to the increasingly visible fragility of the colonial order. It was an approach doomed to fail. The colonial financial system itself militated against the expansion of credit to African farmers. Even after the halting formalization of African land tenure, the commercial banking sector, dominated by expatriate British banks, remained largely uninterested in lending to African farmers. Indeed, it lacked the basic infrastructures in terms of branches, staff, transport, and communications they would have needed in order to do so. In the years that followed, commercial banks actually increased the proportion of their lending for urban commercial operations rather than for farming.

    Mobilizing investment for housing

    A similar dynamic obtains if we skip ahead two decades to the policies aimed at promoting access to housing at the World Bank and USAID. 

    British architect John F. C. Turner was hugely influential over Bank policy in the 1970s and 1980s, especially after the publication of his 1972 book, Freedom to Build. Turner was skeptical of state involvement in housing and celebrated the self-organizing capacity of slum-dwellers. He called for targeted “self-help” programs which would provide access to basic services and secure tenancy. It’s in large part thanks to Turner that from the mid-1970s, the Bank’s discussions of housing policy have supported informal housing as legitimate dwellings, while regularizing their residents’ access to land tenure and credit for upgrading buildings and services.  

    The Bank’s first housing project was in Senegal. Project documents make note of the government’s turn to a more widespread sites-and-services approach based on “a growing awareness of the impossibility of providing more than a small proportion of families” with homes on a public or state-owned enterprise basis. Phasing out subsidies for public housing, the project was organized around “self-help” principles instead. This was justified as a means of “freeing” scarce public resources to be spent elsewhere. At the same time, the broader approach to housing very quickly started to reflect a recognition that scaling-up these projects required injections of outside capital.

    The response at the Bank and elsewhere to these issues presaged key components of the Washington Consensus. Restrictions on access to credit for housing were largely blamed on government interference. Expanding access to mortgage finance was understood primarily as requiring liberalization. A study commissioned by the Bank on financing housing in developing countries, for instance, would note that, “Points of view that interpret usury as an evil have often led to the pegging of commercial bank interest rates at artificially low levels… With excessive demand thus created by controlled interest rates, banks prefer lending to the least risky borrowers.” 

    Yet this “negative” liberalization was always accompanied in practice by more active efforts to shift the risk-reward calculations of private investors. One prominent example here is the Housing Investment Guaranty Fund (HIGF), administered by USAID. The HIGF of $10 million was launched by the US Congress in 1961. By the mid-1970s, it guaranteed more than $1 billion in loans. The HIGF was designed to mobilize American commercial lenders for housing projects in favored countries in the Global South. It worked with national governments and local lenders to design projects, often with a strong institutional development component, aiming to:

    Assist in the accumulation of local capital for long-term mortgage finance operations, the promotion of effective cost recovery systems, the reduction of subsidies, the elimination of unrealistic standards for basic services and the stimulation of the private sector to expand economic development opportunities in urban centers.

    The HIGF guaranteed the original principal and interest to commercial lenders who backed approved housing projects. Again, the arguments used then are echoed in today’s finance gap: without private participation, housing lacked adequate funding. A 1983 review of housing interventions at the Bank, for instance, notes that, “During the early 1970s it became clear that it was beyond the financial resources of all but a handful of developing countries to solve a problem of this magnitude.”

    It is worth noting that interventions under the HIGF generated deeply uneven outcomes that often mirrored the already-existing geographic distribution of capital flows. The HIGF was, even according to its managers, ill-suited to mobilizing finance for the poorest people or countries. This point was made explicit in a number of evaluations, which emphasized that USAID “does not believe that countries with very low per capita incomes are suitable recipients for [HIGF] project loans, since these loans are made on commercial rather than concessional terms.” Likewise: “The commercial-rate financing provided under the… program is not, for the most part, appropriate to meet either the shelter needs of the very poorest income levels (below the 15th income percentile).” 

    Like Swynnerton’s proposals, the flows of capital that were generated through the HIGF or through the Bank’s programming never met the expectations of their promoters, and tended to exacerbate existing patterns of uneven development. Equally important, these interventions over housing help make clear that the finance gap has been shaping the development of neoliberalism for some time. Housing policy at the Bank and USAID operated on a relatively restricted scale, never reaching the level of MF4D, but nonetheless laid a notable amount of the groundwork for the era of structural adjustment.

    Securitizing microfinance

    On a wider scale, microfinancing has also been recently identified as suffering a perceived finance gap, which it has sought to bridge by way of a range of investment vehicles and structured finance mechanisms. In the mid-1990s, officials at the World Bank’s Consultative Group to Assist the Poor (CGAP) noted that microfinance institutions (MFIs) “probably reach fewer than 5% of potential clients. Serving this market will require funding far beyond what donors and governments can provide.”

    Responding to these concerns, support for commercial microlending flourished in the 2000s, in part an effort to scale-up microcredit markets. Microfinance Investment Vehicles (MIVs) proliferated rapidly in the 2000s, with considerable financial support and other forms of encouragement from the Bank and CGAP, as well as key donors. Though differences between the various MIVs exist, they all share a basic model. Investors buy shares in a specific fund offered by an MIV, and the MIV takes those funds and invests in MFIs, either by buying equity or (more likely) by lending funds to MFIs “on the ground.” MIVs mediate between capital markets and MFIs themselves. As Rob Aitken notes, “In order to fully constitute micro-credit as an investable asset, there need to be formalized and regularized routes opened through which it can be accessed by global capital.” 

    A handful of funds—Blue Orchard, Oikocredit, Omidyar, and ProFund in particular—largely dominate the market for MIVs. These large, relatively diversified MIVs are accompanied by several hundred smaller funds which generally specialize in a particular regional or thematic niche (e.g. investing in MFIs specializing in the poorest borrowers). There are significant differences between these firms in terms of how they are set up, but in general MIVs are intended to channel funds from metropolitan investors to microfinance institutions in developing countries. They tend to operate with considerable support from donors. Investors in MIVs essentially delegate decisions about where profitable returns can be made by investing in different MFIs. Expanding rapidly in the 2000s, the MIV sector’s estimated global portfolio grew from just over $1 billion in 2005 to more than $8 billion in 2012.

    Securitization and structured finance were also widely seen as means of mitigating information problems and managing investor risks in ways that might enable greater commercial investment in MFIs. One contemporary economist, Hans Byström, described the appeal as follows:

    Instead of the MFI itself borrowing in the capital market to finance its lending to the microborrower, it can simply transfer the actual assets (the microloans) from the balance sheet to the investor. This is securitization and it could potentially be a viable way for microborrowers to get access to capital.

    The securitization of microfinance was typically framed as a way of ramping up access to lending capital and driving expansion, but it always invoked tensions around commercialization. MIVs and the World Bank played a key role. In 2004, Blue Orchard launched a $40 million collateralized debt obligation (CDO) to fund a set of nine MFIs. The CDO was split into four tranches, a senior tranche backed by a $30 million guarantee provided by the US Overseas Private Investment Corporation (OPIC—at the time, the US government’s development finance arm) and three junior tranches. The CDO financed a group of MFIs, predominantly in Latin America. A follow-up issue was launched in 2005, referencing a slightly larger group of MFIs, and with slightly less participation from OPIC. 

    In 2006, Blue Orchard again followed up these earlier issues with a public CDO referencing twenty-two MFIs and raising USD 106 million. The Blue Orchard CDOs were not collateralizations of micro-loans directly, but rather of loans to MFIs. And indeed, to a geographically uneven handful of MFIs. The first actual securitization of micro-loan payments was launched in 2006, by Bangladeshi MFI BRAC, raising USD 180 million in a securitization issue traded in local currency in Bangladesh. At least part of the aim for BRAC in securitizing its receivables was to diversify its sources of funds, and hence to evade political pressures to reduce interest rates that had tended to come with financing from official sources in Bangladesh. Like most of the other microfinance securitizations, BRAC’s issue was underwritten by a guarantee from development banks—in this case, KfW along with the Dutch FMO.

    These efforts to mobilize private capital to fill this finance gap had impacts that were broadly similar to both Swynnerton’s reforms and USAID’s housing finance programming. Namely, microfinance securitizations and MIVs mobilized much less capital than hoped, and invested it in highly uneven ways.

    Microfinance securitizations were never widespread; in practice only a handful of the largest MFIs in a few countries were able to carry them out. The Blue Orchard CDOs and BRAC securitization were by some distance the largest and most prominent. They weren’t widely emulated, and it’s doubtful that they could have been. SKS in India followed suit with a securitization of USD 42.6 million worth of microloan receivables in 2009, but SKS was already one of the largest and most commercially oriented MFIs. Indeed, the latter exacerbated the uneven distribution of microcredit within India as well by piling new sources of credit into already saturated markets in Andhra Pradesh where microcredit operations were well-established. This ultimately exacerbated growing crises of overindebtedness, leading to the catastrophic breakdown of the region’s microfinance sector following a spate of suicides by distressed farmers. 

    MIVs were, in practice, the source of the largest inflows of capital into microcredit. But these were also distinctly uneven and had limited success in mobilizing private capital. At least in principle, MIVs were heavily marketed to “ethical” investors concerned with their “social impact,” and the market for “socially responsible” investments was identified as a key potential source of further investment in MIVs. In practice, IFIs, including the World Bank’s private lending arm the International Finance Corporation (IFC) as well as regional development banks, have consistently been the largest investors in MIV funds. MIV investments are, moreover, heavily skewed towards a few large MFIs—in 2007, ten MFIs accounted for 26 percent of total MIV investments. And more generally, they were also heavily weighted towards a few countries primarily in Latin America (Peru, Ecuador, Mexico and Bolivia) and post-Soviet Eastern Europe and Central Asia (Azerbaijan, Georgia, Serbia), along with Cambodia and India.

    Politicizing the finance gap

    Put together, the examples above show that contemporary invocations of the finance gap are part of a longer lineage of efforts to coax private finance capital into being redeployed in developmentally beneficial ways.

    It’s notable that financial institutions themselves are rarely in the driver’s seat of the various interventions discussed above. Although Swynnerton, HIGF, MIVs, and MF4D all explicitly privilege the interests of private finance, there is little indication that these past and present efforts to plug various finance gaps have been directly driven by the interests of finance capital itself. Development agencies and states have spent quite a lot of time, with variable success, trying to lure finance capital, but in each case they encounter a structural impasse, indicating the limits of finance capital’s capacity to address poverty and underdevelopment.

    There is truth to the argument that states acting alone lack the resources to fund a rapid transition to a decarbonized economy or reductions in poverty—at least as they’re presently constituted. This is especially true for peripheral states, which tend to feel the disciplinary effects of global finance much more intensely. Yet to frame uneven control over money as a gap skips over the dynamics of overaccumulation and uneven development.

    Invoking the finance gap has always been, implicitly or explicitly, a way of diverting claims for wider redistribution. It means rejecting the public or collective provision of housing, basic needs, and basic infrastructures. The long history of failed efforts to “close” such gaps suggests that these objectives cannot be met without redistributive and democratically controlled public action. The initiatives and reforms described above uniformly failed to meet their objectives, even on their own terms, and often exacerbated existing inequalities in the process. 

    The long history of the finance gap, in short, suggests that the only way we might meet the accelerating social and ecological catastrophes of the twenty-first century is with public or collective control over resources. This means taking expressly redistributive action aimed at repairing the structures of financial subordination which have inhibited meaningful development progress to date. 

  5. Technocracy and Crisis

    Comments Off on Technocracy and Crisis

    On September 25, Italians will be called to elect a new Parliament. The snap election follows on the heels of the collapse of the government in late July and the resignation of former European Central Bank (ECB) President Mario Draghi. That the country would dismiss such an esteemed prime minister and hold early elections—while it remains lashed by the interconnected crises of Covid-19, the rise in energy prices, and an impending recession—has been a cause of consternation and confusion for many in the international press. 

    From the outside, Italian politics appears mystifying and convoluted. In reality, it is quite predictable: Patterns that occurred in previous decades reemerge and repeat themselves in a cyclical manner. For the past thirty years, Italy’s perpetual state of emergency has periodically necessitated the formation of expert-led national-emergency governments. In subsequent elections, disappointed voters shift their allegiance to individuals and organizations that can credibly present themselves as an alternative to the status quo. All the while, a new existential threat on the horizon compels the remaining “responsible” forces to empower a new cohort of technocrats. 

    Marx warned that history repeats itself—first as tragedy, then as farce—but he never elaborated what might come next. Perhaps more germane to the Italian situation is a paraphrase of Nietzsche: Italian politics is the eternal return of the same. In Italy, this pattern is accompanied by a long-term economic decline encompassing stagnating growth and labor productivity, and increasingly precarious jobs. The homines novi (or, more accurately, mulieres novae) who are called upon to save the country are becoming increasingly worrying. 

    As the new secretary of the Partito Democratico (PD), Matteo Renzi benefited from an aura of novelty in the European elections of 2014. The same can be said of the Movimento Cinque Stelle (M5S) when it rose to prominence in 2013—and again in 2018. Both parties lost much of their appeal after their involvement in government produced paltry results, proving themselves unable to halt economic stagnation. Now, with fresh elections to take place later this month, it will be the turn of Giorgia Meloni, leader of the post-fascist Fratelli d’Italia (FdI), to capitalize on the allure of newness. Having remained in opposition to recent governments, especially Draghi’s, she has some claim to outsider status (never mind her and her rumored future cabinet members’ positions in Silvio Berlusconi’s 2008–2011 government). Polls anticipate an avalanche of votes putting her in pole position to lead the next government. 

    The economic crisis

    Once a model of economic development, Italy’s economic growth has been considerably slower than that of other OECD nations since the mid-1990s. There is no consensus among academics regarding the causes of the country’s economic stagnation. Mainstream Italian economists contend that the country’s woes are due to insufficient liberalization reforms, but in fact Italy has introduced more liberalization than many of its European neighbors. In some cases, these reforms have achieved the opposite of their intended goals. For instance, the labor-market liberalization enacted since 1996 has facilitated the creation of low-skill or low-value-added jobs and led to the simultaneous spread of precarious employment and stagnant labor productivity.

    An alternative explanation attributes Italy’s stagnation to the country’s botched integration into the European Monetary Union (EMU). Prior to the financial crisis, the EMU economic architecture allowed two types of growth models: export-led and debt-led growth. The former, exemplified by Germany, was based on a real exchange rate devaluation that stimulated exports and a real wage moderation that depressed domestic demand. The latter model, epitomized by Spain and pre-crisis Ireland, was based on credit creation that fueled a construction boom, which had positive knock-on effects for domestic demand but resulted in substantial current account deficits, financed through capital imports from central and northern European countries. Italy failed to capitalize on either growth driver. Because the Italian export sector is too small to carry the economy on its shoulders, an export-led growth model was unrealistic. And given Italy’s tendency to produce higher inflation than its trading partners within the eurozone and the price sensitivity of its exports, real appreciation penalized Italian exports and made imports cheaper. Furthermore, with extremely high levels of public debt as a proportion of GDP, the primary fiscal balance had to remain in surplus, particularly in the late 1990s. The need to keep government accounts in check made an expansion of domestic demand improbable.

    In the late 2000s to the early 2010s, the country was hit by two shocks in short succession. First, the global financial crisis led to a drastic contraction in demand, to which the government responded with an insufficient fiscal expansion. Then, just a few years later, Italy felt the brunt of the sovereign debt crisis. Although there was no requirement to negotiate a bailout program with the troika, it voluntarily introduced austerity measures (expenditure cuts and taxation increases) as well as structural reforms to regain the confidence of international bond markets. Consequently, the economy fell into a double-dip recession and was unable to recover to pre-crisis GDP levels.

    Then came a third shock: the Covid-19 pandemic. This, too, resulted in a sharp decrease in aggregate demand. This time the government did respond with more robust budgetary expansion, which the EU authorities allowed. Opting for a very different approach to previous crises, it authorized the issuance of shared debt to assist the member states most severely impacted by the pandemic, among them Italy. However, this was not enough to mitigate the effects of the previous crises. Between 1999 and 2020, Italy’s real wages did not increase at all (see graph). External constraints, especially the need to remain a member of the eurozone, governed Italy’s most important policy decisions at critical junctures. 

    The political response

    In recent years, Italy’s politics have been characterized by a peculiar combination of technocracy and anti-elite populism. The reliance on technocratic solutions began with the crisis of the early 1990s, when Italy’s attempt to rigidly fix its nominal exchange rate within the European Monetary System (EMS), the precursor to the euro, led to a competitiveness crisis. This in turn was followed by a confidence crisis, which resulted in the Lira’s expulsion from the EMS. The outcome was not unpredictable for a country with a higher inflation rate than its exchange-rate partners, and therefore subject to real exchange-rate erosion. Not to be discouraged, only three years later, the Italian government decided to double down and enter an even more rigid exchange-rate mechanism: the euro. Within the confines of the euro, the possibility of nominal exchange rate adjustment was completely eliminated.

    Italy’s mode of crisis management was established in the early 1990s. In the midst of the Mani Pulite wave of corruption scandals, a government of unelected experts—led by the Bank of Italy’s former president Carlo Azeglio Ciampi—was installed. It had almost unanimous support from all parties, particularly from the center-left. Its task was to do the dirty work that the parties were unwilling to do: institutionalized wage moderation, expenditure cuts, tax increases, structural reforms. The government collapsed after little more than a year, but it had created the pattern that would be repeated for years to come.

    At the end of 2011, the political response to the euro crisis followed suit. At the time, the yield on Italy’s treasury bonds was reaching unmanageable levels, threatening a default or a bailout package. Mario Monti, a professor of economics and former European commissioner for competition, was hastily chosen as prime minister of a new technocratic government to replace the discredited Berlusconi government. Its main goal was to regain the confidence of international financial markets by implementing policies similar to those imposed by the troika on “program countries,” i.e. business-friendly structural reforms, budget consolidation, and the destruction of domestic demand to produce a current account surplus. Unsurprisingly, the remedy threw the nation into a deep recession, and the proportion of debt to GDP grew even further. Nonetheless, the objective of preserving Italy’s participation in the euro was attained.

    In Italy, technocracy and anti-elite populism are deeply entwined. At critical junctures, when the nation allegedly faces an existential threat, experts are called in to save the day; armed with technical expertise, they claim to understand what it takes to turn around the economy. They impose measures like budget consolidation and structural reforms, which they see as necessary despite their unpopularity. Not being accountable to voters as a political party would be, their task is to simply administer the bitter medicine. Then comes disappointment, as the measures fail to rekindle growth. This failure, however, is not attributed to a misdiagnosis of the problem. Rather, it is society’s stubborn resistance to structural reform that is blamed. In other words, the cure was right, but the patient did not take the prescribed medication, and the dose was insufficient. At the next election, the “responsible” forces that supported technocratic administrations are punished, while the Italian voter swings towards actors that can credibly claim they are not compromised by the status quo, and therefore have the ability to turn things around.

    The winner of the 2013 election, following the Monti administration, was the M5S, whose vote share grew from 0 to 25.5 percent. The young party promised to “open the parliament like a can of tuna fish.” Lacking the votes to form a government, the Movimento remained in opposition. The social-democratic Partito Democratico (PD), heir of the Italian Communist Party, was the dominant party in government during the 2013–2018 legislature, despite performing far worse at the ballot box than predicted by pre-election polls. The PD has evolved into the party of government par excellence. Since 2011, it has participated in every government except one.

    The most recent legislature was more of the same. The M5S won the election of 2018 with almost 33 percent of the vote. In a bid to safeguard Italy’s membership in the euro, which was thought to be threatened by anti-system forces like the M5S and the Lega, President of the Republic Sergio Mattarella sought to cobble together another technocratic government, but failed. Eventually, M5S and the Lega formed a joint government led by Giuseppe Conte, a law professor with no previous political experience. This green-yellow executive passed measures to alleviate poverty (citizenship income) and combat precarious employment (decreto dignità), at the same time as it passed anti-immigrant policy (decreti sicurezza) and made an unsuccessful attempt to flout EU budget rules to engineer a fiscal expansion. The Lega pulled the plug on the government in the summer of 2019—likely to avoid having to sign a budget law that would reduce the public deficit. It also hoped to capitalize on its significant surge in opinion polls in the event of early elections. At the time of the government crisis, the Lega polled well above 30 percent, up from 17 percent in the 2018 legislative elections.

    However, there were no early elections, and a new coalition M5S–PD government led by Conte was created. Starting in February 2020, the government’s first goal was to address the massive health and economic crisis caused by Covid-19, which struck Italy earlier and more harshly than other European countries. The Conte administration was a strong advocate for a unified European approach to the crisis and requested the creation of common European debt. Despite initial reluctance, the German government eventually agreed to this proposal, which led to the introduction of NextGenEU, from which Italy benefited disproportionately by receiving €69 billion in grants and €123 billion in loans to invest in digitalization, healthcare, and the green transition. 

    The life of the second Conte government was cut short by internecine conflict over the management of both the Covid-19 crisis and NextGenEU. This resulted in the formation of yet another technocratic government of national unity, led by Italy’s most prestigious international public servant, former ECB president Mario Draghi. All parties joined the new governing coalition—but for Giorgia Meloni’s Fratelli d’Italia. In refusing participation, Meloni saved her party from the voter discontent that plagued the others. What precipitated the collapse of the Conte government remains unclear, but it cannot be excluded that a new government was required to prevent the M5S, the largest party in parliament, with a strong electoral base in the Mezzogiorno, from managing the allocation and distribution of European funds to benefit its southern constituency. Over the last thirty years, the South has experienced an economic decline even more pronounced than the rest of the country, and the state has ceased any efforts to close the gap. Since one of the objectives of the European funds is to reduce regional disparities, the money should indeed have been largely allocated to the southern regions. But this would have harmed the richer northern regions, the backbone of Italy’s productive system.

    The Draghi government was in office between February 2021 and July 2022. During this period, the M5S steadily lost support—hardly a surprise for a party that pitched itself as an alternative to every other party yet ended up ruling with practically all of them, with mediocre results—as did the Lega. Electoral support for the PD, by contrast, remained stable at 20–22 percent. While the PD benefited little from the M5S’s decline, support for FdI soared to about 25 percent of the vote, becoming the leading party in Italy. 

    The legislature was due to expire in early 2023, with elections to be held in the spring. Its term was foreshortened, however, as the M5S grew increasingly uneasy about backing a government that appeared determined to weaken or reverse a number of its signature policies (such as the citizenship income). In turn, Forza Italia and the Lega wanted a new government that would exclude M5S. Even Mario Draghi seemed unenthusiastic about the prospect of guiding a government through the numerous interconnected emergencies on the horizon—among them continuing support for the war in Ukraine, the energy crisis, rising inflation, the tightening of monetary policy, and possibly a new sovereign bond crisis. Interestingly, the M5S itself was split about whether or not to support the Draghi government, and a substantial number of parliamentarians, who had previously pledged to turn the Italian political system inside out, joined the ranks of the responsible forces backing the government. The government fell nonetheless.

    The limits of change

    With fresh elections on the horizon, front runner Giorgia Meloni is well-positioned to head the next executive. What kinds of changes might we anticipate? Meloni has made it abundantly clear that she wishes to avoid any confrontation with the European Union over budget issues, and she is staunchly on the side of NATO with regard to Italy’s participation in the Ukraine conflict. In terms of economic policy, any new Italian government will have little room for maneuver. Although the Stability and Growth Pact is suspended until 2023 (due to both the pandemic and war), Italy’s involvement in the NextGenEU severely restricts any future expenditure decisions, be it in terms of their nature, amount, or timing. In addition, for a high-debt, low-growth country like Italy, it is crucial that the ECB be prepared to intervene in bond markets as a buyer of last resort. It is prepared to perform this role with the adoption of the Transmission Protection instrument (TPI) in July 2022, but will do so only if the Italian government adheres to the European fiscal rules and honors the commitments of the NextGenEU.

    In 2013, Mario Draghi, then President of the ECB, stated that Italy’s economic policy was “independent of election results” and running “on autopilot.” It’s a statement that is even more accurate now. Italy’s economic policy will continue to be guided by external constraints. However, the shift in government will not be without consequence, and two groups in particular—migrants and the poor—will likely bear the brunt of any changes. Under a Meloni-led government, it will be more difficult for new migrants to reach Italy’s coasts. We may see a repeat of 2018–2019, when refugee-filled vessels were kept anchored outside of ports and denied entry. Existing migrants’ rights, such as access to social services, may also be restricted. This will please the highly anti-immigrant electoral base of the right.

    Beneficiaries of the citizenship income, a sort of basic income, will be the second group to be targeted. According to Italy’s statistical agency ISTAT, one million individuals were lifted out of poverty by the citizenship income in 2020 at a cost of 7.2 billion euros (corresponding to less than 0.5 of GDP). The right holds the citizenship income accountable for the labor shortage that hotels and restaurants experienced last summer. They have pledged to eliminate the citizenship income and reallocate the meager proceeds to one of the right’s primary constituencies: the self-employed and small-business owners. Other initiatives, such as the proposals for a flat tax, are too costly for the incoming government to contemplate without factoring in a tough fight with the EU over budget overshoots.

    To be sure, the measures one can realistically expect from a new right-wing government are unlikely to reverse Italy’s ongoing economic crisis. Beyond September 25, one can expect the cycle of stagnation, emergency, national solidarity governments, and the populist backlash to continue. All this signals the further disintegration of Italy’s existing party system in the years to come. 

  6. A Permanent Bailout?

    Comments Off on A Permanent Bailout?

    The 2008 crisis heralded a new age in central banking. The scale and nature of central bankers’ interventions was unprecedented. Traditionally, as lenders of last resort, central banks lend at escalating rates against good collateral to solvent institutions in times of crisis. In 2008 central banks broke every rule in the book: deviating from the principle of full collateralization, they lent to non-bank entities and made outright asset purchases. This exposed their balance sheets to various credit, interest-rate, and market risks. The European Central Bank made asset purchases under an “enhanced credit support” program that dealt in public securities of various credit risks and even provided liquidity in foreign currencies, primarily the US dollar.1José Manuel González-Páramo, “(<)a href='https://www.ecb.europa.eu/press/key/date/2009/html/sp091110.en.html' target='_blank' rel='noreferrer noopener'(>)The Response of the Eurosystem to the Financial Crisis(<)/a(>)” (speech, Brussels, November 10). The Bank of England made outright purchases of government bonds while the US Federal Reserve purchased up to 90 percent of all new issues of mortgaged backed securities (MBS) to ensure liquidity in US money markets. The Fed also established swap lines with various central banks, including the Swiss National Bank, the ECB, the BoE, and the Bank of Japan. It went as far as to provide these lines to a select few central banks in the Global South, among them the Central Bank of Brazil and the Bank of Mexico.

    Scholars and market watchers have documented and discussed the evolution of crisis-management tools at length. But the most consequential boundary that central banks trespassed was not during the crisis—after all, discretionary measures to prevent a system collapse have been part of central banks’ evolution. The real innovation came in the adoption of crisis tools in noncrisis times, under the banner of so-called unconventional monetary policy. While the use of emergency facilities has attracted much analysis and debate, the adoption of long-term asset purchases in noncrisis times remains underexamined.   

    The rise of interventions

    A quick recap of the British monetary orthodoxy debates of the nineteenth and twentieth centuries provides a sense of just how far central banks have come in embracing an activist role. Intervention went against the classical monetary theory of David Hume and Adam Smith, who advocated an invisible-hand approach to banking: for Hume, this was based on the price-specie-flow mechanism; for Smith, on competitive banking. It was not until the publication of Walter Bagehot’s Lombard Street in 1873, which outlined a role for central banks as what we now know as the lender of last resort (LoLR), that the debate took a turn. Against the background of multiple crises in the centralized English banking system, the Bank of England—until then reluctant to act as a lender of last resort—accepted the legitimacy of intervention in crisis periods. 

    The acceptance of, and justification for, interventions during noncrisis periods (let’s call it monetary policy), however, took much longer. Monetary policy as we know it, while first having been articulated by Henry Thornton, had to wait for Knut Wicksell’s 1898 Interests and Prices to make a mark in the debate. Whereas Bagehot’s primary concern was ensuring an adequate level of reserves and maintaining trust in the financial and monetary system, the Thornton-Wicksellian monetary policy envisioned a broader mandate for the central bank. As lender of last resort, the central bank was to simply defend the banking system against a sudden collapse (defensive central banking); monetary policy, by contrast, sought to influence or fine-tune the real economy through monetary instruments such as the Bank Rate (active central banking).2Arie Arnon, (<)em(>)Monetary Theory and Policy from Hume and Smith to Wicksell: Money, Credit, and the Economy(<)/em(>), (New York: Cambridge University Press, 2010). Prior to the 2008 crisis, most central banks had one goal, price stability, and short-term interest rates were the primary policy lever to achieve it.

    If we fast-forward to the postcrisis period after 2008, we encounter highly active central banks making large-scale asset purchases in the name of monetary policy. Interventions undertaken as part of unconventional monetary policy are indistinguishable from asset purchases made during the height of the 2008 crisis.  For example, during the crisis, the Fed bought up vast quantities of MBS as traditional market-makers refused to take on the risk exposure.3Perry Mehrling, “(<)a href='http://www.bis.org/publ/bppdf/bispap79i.pdf' target='_blank' rel='noreferrer noopener'(>)Why Central Banking Should Be Re-Imagined(<)/a(>),” BIS Papers No. 79, Bank of International Settlements (2014) Subsequently, similar asset purchases came to be understood as unconventional monetary policy, or quantitative easing, whereby the Fed purchases long-term securities through the issue of new money. The Fed has done four major rounds of QE since the 2008 crisis. The resulting expansion in the Fed’s balance sheet is shown in Figure 1. 

    Figure 1: Assets held by the U.S. Federal Reserve. Not shown in this graph is the value of the net portfolio holdings of the Fed’s Corporate Credit Facility which stood at $25.9 billion June 2021.  Source: Federal Reserve Bank of St. Louis.

    One way to interpret these measures is to accept central bankers’ justification that once the policy rate approaches the lower bound, central banks need new tools to provide additional stimulus.4Benjamin Bernanke, “(<)a href='https://www.brookings.edu/blog/ben-bernanke/2020/01/04/the-new-tools-of-monetary-policy/' target='_blank' rel='noreferrer noopener'(>)The New Tools of Monetary Policy(<)/a(>),” Brookings Institution, 2020. Another way to read this is to consider how the shadow banking system requires central banks to broaden their interpretation of monetary policy to include a financial stability mandate. Shadow banking, defined as credit intermediation by nonbank entities,5Financial Stability Board, (<)a href='https://www.fsb.org/2011/10/r_111027a/'(>)“Shadow Banking: Strengthening Oversight and Regulation,”(<)/a(>) 2011. renders the financial system highly vulnerable to sudden losses in liquidity. In shadow banking, liquidity squeezes manifest as confidence crises in collateral value and counterparties, giving rise to “disorderly” or “dysfunctional” financial markets (as opposed to bank runs per se), that is, crisis in modern finance plays out through its plumbing.6Perry Mehrling, “(<)a href='http://www.bis.org/publ/bppdf/bispap79i.pdf' target='_blank' rel='noreferrer noopener'(>)Why Central Banking Should Be Re-Imagined(<)/a(>),” BIS Papers No. 79, Bank of International Settlements (2014); Daniela Gabor, “(<)a href='https://doi.org/10.2218/finsoc.v6i1.4408' target='_blank' rel='noreferrer noopener'(>)Critical Macro-Finance: A Theoretical Lens(<)/a(>),” (<)em(>)Finance and Society(<)/em(>) 6, no. 1 (2020): 45–55. Large-scale asset purchases stabilize the system by injecting liquidity to prop up asset prices and restore confidence in financial securities and markets. Importantly, ensuring financial market functioning, or market liquidity, is also a prerequisite to the conduct of monetary policy.7Benjamin Braun, (<)a href='https://doi.org/10.1093/ser/mwy008' target='_blank' rel='noreferrer noopener'(>)“Central Banking and the Infrastructural Power of Finance: The Case of ECB Support for Repo and Securitization Markets,”(<)/a(>) (<)em(>)Socio-Economic Review(<)/em(>) 18, no. 2 (2018): 295-418; Benjamin Braun and Daniela Gabor, “Central Banking, Shadow Banking, and Infrastructural Power,” in (<)em(>)Routledge International Handbook of Financialization(<)/em(>), edited by Philip Mader, Daniel Mertens, and Natascha van der Zwan. (Abingdon, Oxon: Routledge, 2019).

    Monetary policy works through the plumbing of finance; central banks target the overnight rate primarily through reserve requirements and open-market operations in domestic repo markets. When repo markets freeze and bond and equity markets face disruptions, central banks face challenges in the implementation of monetary policy (moving the short-term interest rate, such as an overnight rate, toward the policy rate) and in its transmission (influencing inflation, employment and growth). It is not surprising then that they cite “dysfunctional financial markets,”8Hervé Hannoun, “The Expanding Role of Central Banks since the Crisis: What Are the Limits?” Bank for International Settlements, June 18, 2010. “disruptions in financial markets,” or “market dysfunction,”9Andrew Hauser, (<)a href='https://www.bis.org/review/r210113a.htm.'(>)“From Lender of Last Resort to Market Maker of Last Resort via the Dash for Cash – Why Central Banks Need New Tools for Dealing with Market Dysfunction,”(<)/a(>) Bank for International Settlements, January 2021. and “malfunctioning of markets”10Jean-Claude Trichet, “The ECB’s Response to the Recent Tensions in Financial Markets.” (speech, Vienna, May 31, 2010) as a key motivation for unconventional monetary operations in the postcrisis period.

    Absorbing risk

    While it is the case that providing economic stimulus (lower market yields, both short- and long-term) is a key driver for QE, equally prominent is the goal of fixing “dysfunctional markets”. The Fed undertook its fourth round of QE in March 2020 during the early heights of the Covid-19 pandemic. When asked why it continued to buy $40 billion per month in MBS despite a strong housing market, Fed chairman Jerome Powell signaled the importance of financial stability: “we started buying MBS because the mortgage-backed security market was really experiencing severe dysfunction…it’s not meant to provide direct assistance to the housing market. That was never the intent.”11The Fed, “Transcript of Chair Powell’s Press Conference — April 28, 2021,” April 29, 2021.

    It is not always clear what objective—stimulus or stability—the Fed targets with asset purchases, a fact recognized by central bankers themselves. According to the 2020 BIS Annual Report, while the objectives of monetary policy and LoLR differ, instruments used in these operations increasingly overlap, making the relationship between monetary policy and LoLR more “complex” and “nuanced.” This overlap poses numerous challenges, one being that whereas liquidity provision through wide-scale asset purchases may be justified as LoLR operations because they are temporary and prevent system collapse, the same does not apply in the case of monetary policy. Asset purchases undertaken in the name of monetary policy appear to be permanent with lasting distributional implications. It involves a major risk transfer: swap out illiquid financial instruments on private balance sheets for high-quality assets, including central-bank reserves, from the Fed. 

    The trend is not limited to the financial core. In fact, central banks in the Global South have long used their balance sheets in normal times to absorb risk for the private sector. This is clearest in the accumulation of foreign-exchange (FX) reserves as an insurance policy against currency crisis, the single biggest threat to financial stability in the Global South. The 1990s and 2000s saw a series of currencies collapse under the weight of short-term volatile capital flows, from the South Korean won to the Turkish lira. Central bankers quickly learned that maintaining financial stability in a rapidly integrating world economy required currency management. This meant that central banks accumulate “war chests” of foreign-exchange reserves (see Figure 2), mostly denominated in US dollars, which they then use to manage the exchange rate via the sale and purchase of hard currencies. As with the Fed’s QE policy, reserve management works to improve central-bank balance sheets. And similarly, it reconstitutes the central bank as a market-maker bearing risk for an increasingly fragile, collateral-intensive, segmented, and yet globally integrated financial system. 

    Private actors who engage in cross-border transactions benefit via the currency hedge that central bank FX purchases provide. In India, for example, reserves held by RBI facilitates the expansion of Indian multinationals such as the Tata Group which borrow vast sums on international capital markets. There is convincing evidence to conclude that when Lehman collapsed, Indian MNCs borrowed dollars from onshore markets to make good on their outstanding payments.12Ila Patnaik and Ajay Shah, “Why India Choked When Lehman Broke,” (<)em(>)India Policy Forum(<)/em(>) 6, no.1 (2020): 39–72. This was of course made possible by the fact that RBI had dollar reserves at its disposal. While reserves help RBI restore stability, the sale of hard currencies during a global liquidity squeeze generally registers losses on the central bank’s balance sheet. The central bank is thus left covering exchange-rate risk and holding a ballooning balance sheet. Moreover, the opportunity cost of holding reserves is sizable, ranging anywhere between 1–3 percent of GDP.13Dani Rodrick, (<)a href='https://doi.org/10.1080/10168730600879331' target='_blank' rel='noreferrer noopener'(>)“The Social Cost of Foreign Exchange Reserves,”(<)/a(>) (<)em(>)International Economic Journal(<)/em(>) 20, no. 3 (2006): 253–66; Kevin P. Gallagher and Elen Shrestha, (<)a href='https://doi.org/10.1111/j.1758-5899.2011.00150.x' target='_blank' rel='noreferrer noopener'(>)“The Social Cost of Self-Insurance: Financial Crisis, Reserve Accumulation, and Developing Countries,”(<)/a(>) (<)em(>)Global Policy(<)/em(>) 3, no. 4 (2012): 501–9. Finally, reserve management can put upward pressure on the interest rate where central banks seek to sterilize FX purchases (which they generally do in the context of price stability), harming domestic borrowers that cannot access international capital markets. Global players benefit from exchange-rate risk insurance at the expense of the public budget and domestically-constrained actors. 

    Figure 2: Foreign Exchange Reserves for Argentina, Brazil, Chile, China, Colombia, Czech Republic, Hungary, India, Indonesia, Lebanon, Malaysia, Mexico, Nigeria, Peru, Philippines, Poland, Russia, Saudi Arabia, South Africa, South Korea, Thailand, Turkey, Ukraine, Uruguay, Vietnam. Source: IMF International Financial Statistics.

    Permanent crisis?

    Why is it that these crisis measures are routinely implemented by central banks, even in “normal” times? There are two possible answers to this question. Either we are in a permanent crisis, and therefore an institutionalized central-bank backstop is essential for financial-market functioning; or, so-called crisis measures should simply be understood as monetary policy and exchange-rate management instruments commensurate to a more complex financial system. The two answers are not mutually exclusive, and both throw up profound challenges to conventional justifications for central bank intervention. The notion that the system is in permanent crisis has major implications, and fundamentally questions basic principles like the efficiency of financial markets and their capacity to disperse risk. In the place of efficient markets, today we find financial markets highly vulnerable to liquidity shocks and dependent on a risk-bearing central bank to generate returns: that is, the socialization of risk and the privatization of returns. If the global financial system needs a permanent backstop, provided by the US Fed, then there needs to be greater public discourse and scholarly scrutiny about what the public should demand in return (beyond a diffuse financial stability goal) for backstopping financial risk-taking, particularly when such “risk-taking” benefits asset-holders and wealthy elites rather than stimulating productive activity in the economy. 

    The notion that these newer measures are the result of central banks updating their tools to new financial realities, requires a more nuanced lens to draw out the implications. In the case of rich economies (and some emerging economies), the reconstitution and expansion of monetary tools requires us to ask: what justifies the expansion in the repertoire of monetary policy instruments, as well as the broadening of monetary policy goals to include financial stability? As Occupy Wall Street and other protests around the world demonstrated, the public views the provision of temporary backstops to the financial system—bailing out financial actors—as unfair. Unconventional banking where central banks provide a permanent backstop through asset purchases seems even more problematic, but the issue remains off the public radar and receives anemic attention in the scholarship. 

    This is concerning given that traditional justifications for central-bank independence, centering on the importance of monetary-policy autonomy and the lack of a clear distributional pattern, no longer hold in an age of unconventional monetary policy.14Jens van ‘t Klooster, (<)a href='https://doi.org/10.1086/706765. 2020' target='_blank' rel='noreferrer noopener'(>)“The Ethics of Delegating Monetary Policy,”(<)/a(>) (<)em(>)The Journal of Politics(<)/em(>) 82, no. 2 (2020): 587–99. Prior to the crisis, central banks relied on a single instrument—the short-term interest-rate—and held themselves accountable to the single clear goal of flexible inflation targeting. Post crisis, tools like QE have direct distributional implications, most saliently with the deepening of inequality: QE increases the value of financial assets and enables share buybacks and speculative trading, benefiting those who can afford to buy and hold financial assets. Moreover, the broadening of monetary-policy goals to include direct lending and asset purchases puts central banks in a position to pick winners and losers, which undermines the case for independence. 

    When it comes to FX reserve accumulation and associated costs in the Global South, the lens needs to be broader, looking beyond central-banking practices to take in the broader monetary and financial arrangements within which central banks are embedded. Given the hierarchy in the international monetary system, central banks in the Global South have little latitude in challenging the mandate of financial stability over credit provision in any meaningful way. Monetary subordination subjects countries to heightened external vulnerability, a dominance in short-term portfolio flows seeking high returns, and structural balance of payment crises.15Annina Kaltenbrunner and Juan Pablo Painceira, (<)a href='https://doi.org/10.1080/13563467.2017.1349089.'(>)“Subordinated Financial Integration and Financialisation in Emerging Capitalist Economies: The Brazilian Experience,”(<)/a(>) (<)em(>)New Political Economy(<)/em(>) 23, no. 3 (2018): 290–313. These obstacles to development should prompt debates about re-imagining the international monetary system and re-constituting it in such a way that the Global South has access to reserves to meet deficits, and the capacity and policy space to exercise sovereignty over capital flows.

    The transfer of risk from private balance sheets to the central bank’s has become a staple of modern finance. As is historically the case, the practice of central banking is far outpacing its theory. In practice, central banking appears to be converging on one goal: addressing market disruptions. It is increasingly difficult to distinguish between LoLR tools on the one hand and monetary or even exchange-rate operations on the other. Central banks in rich economies as well as in the Global South expend enormous resources in guaranteeing functioning financial markets by providing market liquidity through asset purchases. But we lack clear theories about what justifies this active and long-term intervention, particularly in noncrisis times. 

    Central bank balance sheets continue to be inflated as they appear to lack a clear strategy on how to exit financial securities without spooking markets. Even with the threat of inflation, the Fed struggles to meet its target for balance-sheet runoff. As the Fed raises interest rates to target inflation, the interest it will have to pay on its liabilities increases, which may see it register losses. An increase in policy rates at the core will also likely reinforce the need for reserve accumulation in the Global South as investors prefer to hold hard currency assets. Given this permanent embedding of central bank balance sheets in financial markets and the risks that they bear in the name of the public good, the task of theorizing and problematizing wide-scale asset purchases has never been more urgent.

  7. Rating Sovereigns

    Comments Off on Rating Sovereigns

    As dark clouds gather on the horizon of the global economy in the third year of the pandemic—with debt stocks swollen, interest costs rising, and growth undermined by energy insecurity and war—policy makers and pundits are anxiously watching sovereign credit ratings as the harbingers of the storm. What will it take to save Italy from the fatal downgrade to junk status that could bring down not just the fourth largest economy in Europe, but the entire eurozone with it? Could much of the developing world be a few downgrades away from devastating debt crises? Such concerns take history as their guide. In the late 1990s, a series of rapid-fire sovereign downgrades triggered the Asian financial crisis. In the late 2000s and early 2010s, sovereign downgrades played similar havoc with European countries—pushing Greece into default, and forcing eurozone authorities to take desperate measures to save Cyprus, Ireland, Italy, Portugal, and Spain from the same fate. In both instances, sovereign ratings were blamed not only for having failed to predict the debt servicing difficulties of the countries in trouble, but also for exacerbating the crises via belated and panicked downgrades.1Ferri, G., Liu, L. G., & Stiglitz, J. E., “The procyclical role of rating agencies: Evidence from the East Asian crisis.” (<)em(>)Economic Notes(<)/em(>) 28, no. 3 (1999), 335-355; Gärtner, M., Griesbach, B., & Jung, F., “PIGS or lambs? The European sovereign debt crisis and the role of rating agencies.” (<)em(>)International advances in economic research(<)/em(>) 17, no. 3 (2011) 288-299. Sovereign ratings exercise spectacular—and often disastrous—power in times of crisis.

    At the same time, sovereign ratings also exert subtler, but no less problematic influence over the fate of countries in “normal times.” The judgment that sovereign ratings pass about a country’s creditworthiness consistently affects the interest rate that the country has to pay on its debt. Lower ratings increase the burden of interest costs on the budget, shrinking the amount of money available to provide public services, address social needs, manage the economy or fulfill any other important political, social and economic objectives. The larger the outstanding debt, the greater the budgetary impact of ratings. Given the high and growing indebtedness of governments around the world in the past decades, even a couple of dozen basis points of increase in interest costs associated with adverse rating changes can make a tangible effect on the budget. Furthermore, sovereign ratings affect the financing costs of all economic actors across the domestic economy, thereby indirectly influencing the functioning of equity markets, growth, unemployment and competitiveness.2Brooks, R., Faff, R.W., Hillier, D., & Hillier, J. “The national market impact of sovereign rating changes.” (<)em(>)Journal of Banking & Finance(<)/em(>), 28 (2004) 233-250. Therefore, governments face very strong incentives to try to stay in the good graces of the rating agencies. 

    Indeed, rating agencies have been called the “new superpowers” of our globalized world, whose influence over governments’ financial elbow room rivals that of the best-known wielders of financial power, such as the International Monetary Fund or the World Bank. And just as the concern about international financial institutions is that they make funding conditional on policy choices that countries would not make on their own, the worry about credit-rating agencies is that they interfere with the sovereignty of democratically elected governments by tying favorable funding conditions to specific policy choices. Indeed, scholarly research has shown that the Big Three regularly comment on the politics and policy choices of the countries they rate, 3 Barta, Z., & Makszin, K. ” The politics of creditworthiness: Political and policy commentary in sovereign credit rating reports.” (<)em(>)Journal of Public Policy(<)/em(>), 41, no. 2 (2021), 307-330. and they assign lower ratings to countries with center-left governments 4 Barta, Z., & Johnston, A., “Rating politics? Partisan discrimination in credit ratings in developed economies.” (<)em(>)Comparative Political Studies(<)/em(>) 51, no. 5 (2018) 587-620.; Vaaler, P. M., Schrage, B. N., & Block, S. A. , “Elections, opportunism, partisanship and sovereign ratings in developing countries.” (<)em(>)Review of Development Economics(<)/em(>) 10, no. 1 (2006) 154-170. and large welfare commitments. 5 Barta, Z., & Johnston, A., “Entitlements in the crosshairs: how sovereign credit ratings judge the welfare state in advanced market economies.” (<)em(>)Review of International Political Economy(<)/em(>) 1, no. 27 (2020). The fact that unelected, unappointed, for-profit commercial organizations can put a price tag on electoral and policy choices in democracies around the world should give us pause.

    Sovereign ratings continue to exercise immense power over the fate of governments—in good times and bad—despite vigorous attempts in the wake of the last crisis to “break the power” of the “Big Three” credit rating agencies—Fitch, Moody’s and Standard and Poor’s—in Europe and the US alike. Incensed by what they claimed were unfair,  aggressive and harmful downgrades in the midst of financial, fiscal and economic troubles that the Big Three themselves were partially responsible for, policy makers committed to sidelining ratings from public regulatory systems, and promised to create new, better (public) rating institutions. US authorities brought billion-dollar lawsuits against the Big Three. Congress created extensive regulatory oversight over the credit-rating business, and eliminated the public use of credit ratings under the Dodd-Frank Wall Street Reform and Consumer Protection Act. In Europe, the Parliament and Council created the European Securities and Market Authority with the explicit purpose of regulating the credit rating industry as one of its main responsibilities. Yet, more than ten years later, the Big Three are just as influential (and profitable!) as ever, and once more the public braces itself for a potential new wave of sovereign debt crises triggered by downgrades.

    The resilience of sovereign ratings in general and the Big Three in particular is all the more remarkable because—quite apart from regulatory action—investors themselves had strong incentives to break with ratings and the Big Three, given the grave losses they suffered in successive crises due to rating failures. The fact that markets continue to rely on the ratings of the Big Three, instead of trusting their own risk assessment, experimenting with alternative risk metrics, or availing of the services of other rating agencies has profoundly puzzled expert observers. The staying power of the Big Three is truly striking. 

    A common language

    Understanding why the Big Three became such influential, and apparently unassailable, gatekeepers of sovereign-debt markets starts with debunking a common (intuitive but misleading) conception about the role that ratings play in financial markets today. Ratings—with their well-known alphanumeric code—denote categories of credit risk, ranging from virtually riskless ‘AAA’ all the way to default-prone ‘C’. As indicators of risk, ratings are commonly construed as a decision-support tool for investors: a due diligence of investment options to identify and highlight risks that investors might otherwise be unaware of. This conception of ratings is reflected, for example, in the lawsuits and legislative changes that sought to make rating agencies liable for the losses suffered by investors as bond prices collapsed in the wake of successive rating failures, implying that drastic rating changes exposed fraudulent, negligent or incompetent handling of the due diligence task that the Big Three took upon themselves. 6 Gaillard, N. J., & Waibel, M. “The Icarus Syndrome: How Credit Rating Agencies Lost Their Quasi-Immunity.” (<)em(>)SMU L. Rev.(<)/em(>), 71, no. 1077 (2018). 

    Interpreting ratings as a due diligence mechanism is intuitive but anachronistic. Historically, rating agencies did start out as fact-finding and -analyzing enterprises. Emerging in the late 19th and early 20th centuries in the United States, they helped investors assess the bonds of railroad companies and provided businessmen with basic information about little-known clients they contemplated extending commercial credit to.7Carruthers, B. G., “From uncertainty toward risk: The case of credit ratings.” (<)em(>)Socio-Economic Review(<)/em(>) 11, no. 3 (2013), 525-551. But the compilation and analysis of difficult-to-access information declined in utility in the 1970s, with the advent of the information age and the ascendancy of institutional investors in bond markets. Armed with practically limitless (often privileged) access to information, modern computing power and armies of highly trained analysts and portfolio managers, contemporary institutional investors no longer need to rely on rating agencies for information, insight or judgment. 

    Yet, rather than make them redundant, the rise of the institutional investor has made credit ratings an indispensable component of contemporary financial markets. Ratings became a crucial coordination mechanism to facilitate the interactions of institutional investors with one another and with their stakeholders. Instead of unearthing novel information, ratings now serve as commonly accepted, third-party indicators of credit risk to enable institutional investors, their clients and regulators to negotiate about risk, enter transactions, and manage relationships characterized by asymmetric information. 

    Since institutional investors invest money on behalf of others, they may be inclined to take higher risk than would be acceptable to their clients in the hope of realizing higher returns. Managing this moral hazard is of central concern to clients and to regulators, but devising private or public rules to regulate the risk-taking of institutional investors is predicated upon a common understanding of how risky each credit instrument is. Since clients and regulators cannot possibly keep track of the riskiness of innumerable bonds from across the globe in the portfolios of institutional investors, portfolio mandates and official regulations depend on ratings as commonly trusted third-party indicators of credit risk to define limits on risk-taking. Without an independent measure of credit risk, institutional investment on behalf of millions of investors would be unfeasible. Ratings serve to mitigate information asymmetries between institutional investors, clients, and regulators through independent risk estimates.

    In dealings among institutional investors, ratings serve as a shorthand for defining minimum quality standards for collateral used to secure against counterparty risk in the myriad transactions (mostly repos) that make up a large part of the volume of activity in modern financial markets. Rather than mitigating information asymmetry, in this case ratings allow for efficient transactions without having to negotiate (and repeatedly renegotiate, as circumstances change) standards for acceptable collateral in each specific deal. Without a common standard for denoting risk, transactions among institutional investors would be too cumbersome to be practical.

    What ratings do in both of these settings is—as David Beers, Standard and Poor’s Global Head of Sovereign and International Public Finance once put it—provide a “common language of credit risk”8Quoted in Abdelal, R. (<)em(>)Capital Rules: The Construction of Global Finance. (<)/em(>)(Cambridge: Harvard University Press, 2007) p.174 that actors enmeshed in a complex web of financial market transactions can use to negotiate and regulate their relationships. By supplying a common language, ratings play a crucial role in supporting the relationships and transactions that constitute contemporary financial markets. They play an infrastructural function comparable in significance to that of SWIFT, the interbank payment system. Whereas SWIFT physically transfers messages about transactions, ratings provide the vocabulary for defining vital terms of transactions and relationships. Sovereign ratings—and particularly sovereign ratings on the upper end of the rating scale—play a particularly important part in this vocabulary, because highly-rated sovereign bonds make up the bulk of the so-called safe assets that are most commonly used to safeguard client-investor relationships and inter-investor transactions. Without a common language for what constitutes safe enough assets to reassure clients, regulators and counterparties, these transactions and relationships—i.e. modern financial markets—could not function.

    Empowered by convention and failure

    Why do the Big Three retain a monopoly over this medium of communication? Although several dozen credit-rating agencies are registered across the US and Europe, the Big Three continue to overwhelmingly dominate the rating market, with a practically 100 percent share in sovereign ratings.9In 2020, in the American market, 99 percent of outstanding ratings of government bonds (treasuries, agency, municipal, and so on) were (<)a href='https://www.sec.gov/ocr/ocr-reports-and-studies.html' target='_blank' rel='noreferrer noopener'(>)issued(<)/a(>) by the Big Three, as well as 87, 85, 77 and 60 percent of the outstanding bonds in the corporate, financial, insurance and asset-backed sectors, respectively. (A curious feature of the rating market is that it is characterized by a joint monopoly of Fitch, Moody’s and Standard and Poor’s—with Moody’s and Standard and Poor’s both having a 100 percent of the market and Fitch holding a somewhat lower share. That is because the overwhelming majority of collateral standards and private or public regulatory documents call for at least two ratings and specifically require ratings by Fitch, Moody’s and Standard and Poor’s.)10 Cantor, R., Ap Gwilym, O., & Thomas, S. H. “The use of credit ratings in investment management in the US and Europe.” (<)em(>)The Journal of Fixed Income(<)/em(>) 17, no. 2 (2007) 13-26. In the wake of the last crisis, new contenders threw their hats into the ring with some fanfare, but their initiatives petered out before they could properly set up their operations, while existing competitors continued to be constrained to narrow niches of the rating market.

    The Big Three gained first mover advantage in the market for a global lingua franca of credit risk between the mid-1970s and the early 2000s, when they were the only “nationally recognized statistical rating organizations” in the United States.11Abdelal, R., Blyth, M., “Just who put you in charge? We did: CRAs and the politics of ratings.” In Cooley, A., & Snyder, J. (eds.) (<)em(>)Ranking the world: Grading states as a tool of global governance(<)/em(>), (Cambridge: Cambridge University Press, 2015) 39-59. Obliged to use the Big Three for public regulatory purposes, institutional investors fell back on the same method of risk certification in their own private portfolio mandates and contracts, too. Thus, the ratings of the Big Three became entrenched in both public and private use in the United States just as modern financial structures were born. Given the dominance of American financial markets and investors within the international financial system, the practice of using the ratings of the Big Three as commonly accepted indicators of risk was exported as globalization progressed. The world settled on the convention that when market actors need to discuss credit risk, they universally speak the language provided by the Big Three. This convention goes a long way towards explaining why no competitors organically grew into serious challengers even after the Securities and Exchange Commission opened up the status of “nationally recognized statistical rating organizations” to new applicants, and the European Securities and Market Authority registered several dozen new rating agencies. 

    Convention alone cannot explain why the Big Three retained their monopoly over the global language of risk, after the language they provided repeatedly proved so fragile. “AAA” is supposed to mean practically zero credit risk, whereas “BBB” reflects tangible, if moderate, doubts about payment capacity. If a AAA-rated sovereign can become BBB-rated within a relatively short period of time (like Ireland or Spain did in the European debt crisis), “AAA-rated” no longer denotes the kind of safety that market actors meant to enshrine in their contracts and portfolio regulations. When ratings drastically change, market actors are forced to make hasty changes to their portfolios to adhere to the stipulations of the contracts and regulations that bind them. Such forced adjustments have the potential not only to impose losses on individual investors but also to destabilize entire markets by triggering simultaneous adjustments across innumerable portfolios and placing enormous pressure on the prices of the affected bonds. 

    In light of the deleterious effects of failing ratings, any competitor able to offer more reliably accurate indicators of credit risk should have the potential to supplant the Big Three. But reliably accurate indicators of credit risk—especially sovereign credit risk—are a mirage. Credit relations are characterized by uncertainty, not risk: it is not possible to accurately account for all possible contingencies that might affect the future ability and willingness of debtors to service their debt over the lifetime of bonds and assign “realistic” probabilities to all conceivable outcomes. This is especially true for sovereign debtors whose debt servicing capacity is determined by the complex interaction of political, economic, and fiscal factors. Absent a crystal ball, sovereign ratings (or any other forms of sovereign credit analysis) are no more than educated guesses about the future credit standing of countries, liable to be proven wrong from time to time by adverse surprises. 

    Furthermore, even if analysts compensate for the limits of their foresight by preemptively lowering ratings to reflect threats to debt servicing capacity from conceivable negative surprises, they cannot insure ratings against market panics. Whereas even the most dramatic political, economic or fiscal blows rarely cause a country with previously strong debt servicing capacity to renege on its debt commitments, a “sudden stop” of funding, caused by panic, might do that. “Sudden stops” make it impossible for countries to roll over their expiring debt at an interest rate that they can afford to pay, forcing them to default even if they otherwise have good credit standing. Maintaining investment-grade rating on a sovereign that defaults is the ultimate disgrace that can befall a rating agency. Therefore, at any signs of panic brewing, ratings have to precipitously fall (towards speculative grade) to reflect the growing possibility that the given country is careening into default—irrespective of what the country’s economic, political and fiscal fundamentals warrant. But, of course, falling ratings fuel further sell offs—as investors try to comply with margin calls on collateral and rating requirements in regulated portfolios—triggering further downgrades. Once panic starts, ratings fail.

    Indeed, sovereign ratings have so far always failed by falling victim to panic. The Irish example is illustrative of this dynamic. Even though the shock that hit Ireland’s public finances was tremendous—by bailing out domestic banks, the government increased the country’s debt by almost a hundred percent of the GDP—the country’s debt servicing capacity was not fundamentally undermined. Once the dust settled after the crisis, Irish sovereign ratings settled on A+. This was not the coveted AAA that Ireland used to hold, but a decent investment-grade rating. However, during the crisis, as investor panic drove yields on Irish debt through the roof, there was a very real possibility that Ireland would lose its access to market funding altogether, triggering a rapid succession of downgrades, plunging Ireland from AAA in 2009 into non-investment grade territory by mid-2011, when markets were finally calmed by a bailout package from the troika of the International Monetary Fund, the European Commission and the European Central Bank.12Moody’s downgraded Ireland to Ba1, while S&P and Fitch kept it just on the lower boundary of investment grade at BBB-. Whereas some downward adjustment in the longer term was clearly warranted by the shock to public finances, the mayhem of the 10-notch drop within two years (a manifest rating failure) was driven by market panic incommensurate with the original shock that triggered it, as evidenced by the five-notch correction after the crisis. Other country cases in the Asian financial crisis and the European debt crisis illustrate the exact same pattern.13In 1997, the ratings of South Korea fell from AA- to B+ within four months, only to climb back to A- in the next six years (a 10-notch drop followed by a 7-notch correction). The ratings of Thailand moved from AA to BBB- within a year in 1997, and then to BBB+ by 2003 (5 notches down, 2 up). Malaysia went from A+ to BBB- within a year between 1997 and 1998, then back up to A- by 2003 (5 notches down, 3 up). Spain, also AAA-rated at the start of the crisis, teetered on the brink of junk with a BBB- rating in 2012, before recovering to BBB+ in 2015 and A in 2018 (a 9-notch drop followed by a 4-notch correction). Portugal plunged from AA- in 2009 to BB in 2012, to climb back up to BBB in 2019 (an 8-notch drop and a 3-notch correction).

    Given the universality of this dynamic in times of crisis, there is little reason to hope that similar dynamics will not unfold in the future, or that alternative indicators of credit risk would not be vulnerable to this mechanism. Failures of credit risk indicators are baked into the markets. Consequently, even if the Big Three commit mistakes in their credit-risk analysis (which they certainly do), any improvement on their performance is ultimately bound to be marginal given the inevitability of failure of any indicators of credit risk in the face of bad news and market panic. The measurement of credit risk is an essentially illusory undertaking, predestining anyone that attempts it to recurrent failure. This fact explains not only the petering out of private initiatives for supplanting the Big Three, but also the manifest reluctance of public regulators to get involved in the production of risk indicators.14Stellinga, B., & Mügge, D., “The regulator’s conundrum. How market reflexivity limits fundamental financial reform.” (<)em(>)Review of International Political Economy(<)/em(>) 24, no. 3 (2017), 393-423.

    The futility of attempts to produce reliable estimates of credit risk does not undermine the vital need of contemporary financial markets for independent, authoritative, third-party indicators of credit risk, to be used in negotiating the relationships of institutional investors with their clients, regulators, and one another. What it does is militate strongly against destabilizing the current entrenched convention around the Big Three as providers of the crucial common language of risk for the sake of experimenting with alternatives. Reluctance to rock the boat in the absence of better options helps to account for the timidity of authorities in enforcing regulations that would have undermined the willingness or ability of the Big Three to continue to provide their services. The most conspicuous example of this was the reversal of the decision under the Dodd-Frank Act: to make rating agencies legally liable for their opinions. The legislative change was promptly revoked when the Big Three threatened not to authorize the use of their ratings in prospectuses and debt registration statements, causing severe dislocations in the market.15Marandola, G., & Sinclair, T. J. “Credit rating agencies are poorly understood and the rules developed for them will not work.” In (<)em(>)Handbook on the Geographies of Money and Finance(<)/em(>). (Cheltenham: Edward Elgar Publishing, 2017). Other provisions of the Dodd-Frank reforms—like the tasking of the Securities and Exchange Commission with either changing the business model of rating agencies or creating a board that randomly assigns credit rating assignments to one of the nine nationally recognized statistical rating organizations—were quietly shelved without any attempt to implement them. Similarly, in Europe, regulations never went beyond technical details like requiring a set rating calendar or rules for disclosure. Regulatory forbearance underscores that, for all their faults and failures, the ratings of the Big Three are the only game in town. 

    Reflexivity

    The tenacity of the Big Three is full of paradoxes. The firms derive immense power and spectacular profits from having joint monopoly on an impossible task. The fact that they are bound to repeatedly fail at that task—with grave consequences for financial markets and entire national economies—neither diminishes the demand for their services, nor threatens their monopoly. In fact, inevitable failure further cements their position as pivotal actors in financial markets whose authoritative judgment on risk governs portfolios and contracts around the globe. Nevertheless, for all their authority, the Big Three are also hostages to markets given the immense vulnerability of their ratings to sudden adverse changes in market sentiment. When markets respond to unexpected bad news with signs of panic, foreshadowing the possibility of a “sudden stop,” ratings have to tumble to reflect impending disaster. But exactly by doing that, they unleash a meltdown of bond prices, fulfilling the prophecy of disaster. Caught in a predictable, yet unavoidable, vicious cycle, ratings drive themselves and markets into failure—becoming both the victims and the culprits of crises. 

    While intriguing in its own right, the logic of credit ratings also highlights crucial vulnerabilities in contemporary global financial architecture. Beyond the fact that the transactions that make up the bulk of financial market activity around the globe are governed by a shaky illusion (that credit risk can be measured), the logic of ratings also calls attention to the heightened danger of intensified market reflexivity.16The term was coined by George Soros: see Soros, G. (<)em(>)The New Paradigm for Financial Markets: The Credit Crisis of 2008 and What It Means(<)/em(>) (New York: Public Affairs, 2008) Financial markets have always been complex systems of interconnected decisions in which investors try to anticipate what the market at large might do, generating potentially destabilizing movements. However, in contemporary global financial architecture, the proliferation of relationships and transactions that require a common language of risk has amplified the coordination of destabilizing developments around the globe. Investors were always watching the market, but there used to be some room for differences in perceptions that would dampen herd effects. With a vast share of portfolios legally forced to follow changes in ratings en masse, ratings became the focal point of reflexivity overpowering any stabilizing effects of potential differences in opinions. The more one contemplates ratings, the more reasons emerge to eliminate them altogether. Doing so without dismantling the broader global financial architecture that encases it, however, seems doubtful.

  8. Pragmatic Prices

    Comments Off on Pragmatic Prices

    The following is an adapted excerpt from How China Escaped Shock Therapy: The Market Reform Debate.

    Price setting in the Second World War

    European and American traditions of economic theorizing on price control are intimately connected with war. The experience of the First World War had been one of inflation and limited price controls throughout its duration, followed by a sudden liberalization after the war’s end. The transition from war to peace gave rise to a sharp boom bust cycle and eventually led to the Great Depression.

    The experience stood as a warning for policymakers during World War II. With the exception of China, all major powers experiencing hyperinflation1Weber, I. M. “The Ordoliberal Roots of Shock Therapy: Germany’s ‘Economic Miracle’ in China’s 1980s Reform Debate.” In: Slobodian, Q. and D. Plehwe (Eds.),Market Prophets from the Margins: Neoliberals East and South (Brooklyn: Zone Books, forthcoming). implemented price and wage controls that were far more comprehensive than those of the First World War: “Controls over prices and wages were the rule; freedom from such regulation was the exception.”2Galbraith, J. K. (<)em(>)A Theory of Price Control(<)/em(>), (Cambridge, MA: Harvard University Press, 1980), 1. Despite their scale, the policies were not based on elaborate theoretical principles. In fact, some of the most sophisticated 20th century economists—Keynes, Hansen, Galbraith—were unable to reconcile with the realities of the war economy. John Kenneth Galbraith, the most prominent American price-fixer of the Second World War, described inflation control as an evolutionary development “in the sense that the final structure was influenced less by an effort to build to an overall design than by a series of individual decisions.”3Galbraith, (<)em(>)A Theory of Price Control(<)/em(>), 45

    In the following extract, I survey the theory, practice, and outcomes of price setting during the Second World War and its aftermath. In doing so, I argue that the implementation and practice of American price controls was less a result of ideology, economic theory or calculation than pragmatic decision making according to economic needs. In fact, the most beautiful theoretical plans for inflation policies crumbled when confronted with the reality of the war economy. The pragmatism that ultimately served to stabilize prices was made possible through the surrender of theoretical dogmas in the face of emergency.  

    Three views on wartime inflation

    In 1940, Keynes’s How to Pay for the War set the tone for reflections by professional economists on war finance and economic stabilization. His considerations of the war economy radically departed from the principle of effective demand—the concept for which he is most famous. Keynes had derived the importance of effective demand for the general case of peacetime in his General Theory. But he did not believe that it applied to the special case of war: “[I]n war time, the size of the cake is fixed,” he argued. “If we work harder, we can fight better. But we must not consume more.”4Keynes, J. M. (<)em(>)How to Pay for the War: A Radical Plan for the Chancellor of the(<)/em(>) (<)em(>)Exchequer(<)/em(>). (New York: Harcourt, Brace and Company, 1940).

    According to Keynes, the reason for this difference was that, in times of war, all expansion of production is to supply the goods needed for the war: “The war effort is to pay for the war; it cannot also supply increased consumption.” 5 Keynes, (<)em(>)How to Pay for the War(<)/em(>), 30 Under conditions of war, Keynes argued, the government had to expand its spending and, before full employment of labor and capacity was reached, demand for consumption goods exceeded their supply. This was the case because “[e]ven if there were no increases in the rates of money-wages, the total of money-earnings [would] be considerably increased.”6Keynes, (<)em(>)How to Pay for the War(<)/em(>), 8 Keynes suggested that people previously unemployed or not in paid employment were drawn into military service or civilian war production and hence received a money wage. The aggregate wage fund increased, but it encountered roughly the same amount of consumption goods that had been available before that increase.

    In principle, Keynes indicated three alternatives for solving this problem. A laissez-faire solution, comprehensive price controls and rationing, and his preferred scheme of deferred pay combined with price controls for selected essentials. The first was based on the assumption that peacetime economic policies and taxation were, in essence, fit to serve the war economy and needed only to be complemented with propaganda to encourage voluntary saving. 7 Keynes, (<)em(>)How to Pay for the War(<)/em(>), 58 Keynes found it highly unlikely that voluntary savings were sufficient to limit the purchasing power in order to match the constrained consumption supply as well as to provide the necessary finance for the war effort.8Keynes, (<)em(>)How to Pay for the War(<)/em(>), 9, 28, 69 This scheme would imply a repetition of the policy of the First World War, which entailed a “sufficient degree of inflation to raise the yield of taxes and voluntary savings.”9Keynes, (<)em(>)How to Pay for the War(<)/em(>), 58 But this would not actually be a voluntary saving. It would, rather, be “a method of compulsory saving, converting the appropriate part of the earnings of the worker which he does not save voluntarily into the voluntary savings (and taxation) of the entrepreneur.”10Keynes, (<)em(>)How to Pay for the War(<)/em(>), 69

    Keynes warned that inflation would be fueled by a price-wage spiral. As the economy approached full employment and the wage fund increased, prices would rise. If workers were compensated for the rising prices, this would put renewed pressure on the price level.11Keynes, (<)em(>)How to Pay for the War(<)/em(>), 74 As a result of accelerating inflation, workers would be left without savings and without increased consumption enjoyments. Capitalists, on the other hand, would profit from the increasing prices and would become creditors to the government. Keynes cautioned that, after the war, the state would be left with very high debt in the hands of a few powerful and rich. The workers would have paid with their labor for the war but been left with nothing.

    If Keynes’s first alternative was somewhat laissez-faire, the second alternative was the opposite. It was to “control the cost of living by a combination of rationing and price-fixing.”12Keynes, (<)em(>)How to Pay for the War(<)/em(>), 51 Keynes took an equally critical stance toward this approach. It might be “a valuable adjunct” to his main proposal, but it would be “a dangerous delusion to suppose that equilibrium [could] be reached by these measures alone.”13Keynes, (<)em(>)How to Pay for the War(<)/em(>), 51

    In Keynes’s eyes, price controls would not serve to effectively limit the excess purchasing power that resulted from the war-driven expansion of employment. “[I]t would never be practicable to cover every conceivable article by a rationing coupon” and, by the same token, to control all prices. 14 Keynes, (<)em(>)How to Pay for the War(<)/em(>), 52 Therefore, Keynes suggested that the purchasing power would be redirected toward those commodities, which remained uncontrolled because they attracted relatively little demand. The consumer would end up receiving what is “least desirable” while an overall excess demand remained and drove up the prices of these uncontrolled commodities.

    In sum, for Keynes, comprehensive price controls and rationing were unlikely to be effective in containing the excess purchasing power. If, against his prediction, they were to be effective, the result would be an undesirable allocation of the limited supply of consumption goods.

    Instead, Keynes promoted a third alternative: “a scheme of deferred pay” combined with carefully selected price controls to the extent necessary. He argued that the excess purchasing power of the wage earners should be withdrawn during wartime by forced saving with a government-run bank. This way, they would be rewarded after the war by “a share in the claims on the future which would otherwise belong to the entrepreneurs.”15Keynes, (<)em(>)How to Pay for the War(<)/em(>), 74 Keynes thought that inflation would be contained by the resulting temporary reduction in aggregate demand. The same could be achieved by taxation, but in this case, the wage earner would be left without any individual claim on future wealth.

    The plan of deferred pay was to be assisted by limited price controls and rationing, which would serve “to divert consumption in as fair a way as possible from an article, the supply of which has to be restricted for special reasons,” such as the interruption of foreign trade. 16Keynes, (<)em(>)How to Pay for the War(<)/em(>), 53 Such a diversion of demand should, according to Keynes, take the form of rationing and price control only “if this article is a necessary, an exceptional rise in the price of which [was] undesirable.” 17Keynes, (<)em(>)How to Pay for the War(<)/em(>), 54 For all other goods, demand should be checked by “the natural method” of a rising price in response to a limited supply.

    Keynes’s plan for deferred pay was the most prominent theoretical contribution to the question of war finance, not only in the United Kingdom but also in the United States.18Galbraith, (<)em(>)A Theory of Price Control(<)/em(>), 5-6. Even Hayek acknowledged that Keynes had set the standard for thinking about the problem of wartime inflation.19Hayek, F. A. “Review: How to Pay for the War by J. M. Keynes.” (<)em(>)The Economic(<)/em(>) (<)em(>)Journal(<)/em(>), 1940: 50(198/199), 321–326. Another important contribution more tailored to the specific conditions in the United States came from Alvin Hansen, an institutionalist and one of America’s leading teachers of Keynesian thought at Harvard University.20Hansen, A. H. “Defense Financing and Inflation Potentialities.” (<)em(>)The Review of(<)/em(>) (<)em(>)Economics and Statistics(<)/em(>), 1941: 23(1), 1–7.

    Hansen departed to some extent from Keynes in his vision of price controls. For him, “until an approach to full employment [was] reached … the main danger of inflation [was] in the development of bottlenecks”21Hansen, “Defense Financing,” 6 and, hence, these bottlenecks should be the primary target of anti-inflation policy. Hansen recommended that “the weapon of specific price increases where these may help eliminate bottlenecks” should be used when “provision of adequate plant and equipment capacity and … an adequate supply of skilled mechanics” was readily forthcoming.22Hansen, “Defense Financing” In the event of a lack of such capacity and labor with regard to a specific bottleneck, however, direct price control and rationing could help prevent inflation. Hansen saw the most serious of these bottlenecks in steel. 23 Hansen, “Defense Financing,” 1 Thus, he differed from Keynes by shifting attention from price controls on necessary consumption goods to those on production goods. While Keynes’s plan relied almost entirely on the relationships between homogeneously perceived aggregates, Hansen considered the great asymmetries in sectorial production capacities and demand pressures. In this view, shortages could exist side by side with oversupply driving inflation up long before full capacity utilization.

    Galbraith—then a young economist—made his name by deepening Hansen’s analysis of such heterogeneities. He too emphasized the pressing need to prevent inflation, which had as a result of the First World War been an “almost paranoiac concern in 1940 and 1941.”24Galbraith, J. K. (<)em(>)A Life in Our Times(<)/em(>). (Boston: Houghton Mifflin Company, 1981), 127 But neither Hansen’s peacetime-inspired notion of bottlenecks nor Keynesian considerations of some aggregate relations would serve to capture the dramatic change in requirements resulting from war and, hence, to understand the problem of war inflation. According to Galbraith, the problem of the war economy was “progressively more difficult” than these two notions suggest, and it entailed nothing less than a reorganization of the resources in the whole economy. Under the circumstances of such restructuring, one would “encounter a steadily increasing number of industries where the supply function [would] be inelastic.” As a result of these rigidities, Galbraith argued, there would be “price advances in the interim” and “[f ]ull employment will have little or no relation to the appearance of inflation.”25Galbraith, (<)em(>)A Life in Our Times(<)/em(>), 83

    Nevertheless, Galbraith remained optimistic that “[r]easonably full use of resources without serious inflation [could] be achieved.” But, contrary to Keynes, in Galbraith’s view, it was impossible to “rely entirely, or even in major part, upon measures which reduce[d] the general volume of spending in the economy.”26Galbraith, (<)em(>)A Life in Our Times(<)/em(>), 84 Such a reduction in aggregate demand had to be combined with direct measures to facilitate the industrial reorganization. This, according to Galbraith, had to include two main tasks: first, it was necessary to develop capacity, skills, and domestic sources of material supply to smooth the expansion of anticipated pressure points; second, “in the areas where resistance develop[ed]… specific price controls or price-fixing” supported by a degree of rationing was needed. Thus, Galbraith believed in a role for Keynes’s investment policies during wartime, while Keynes himself had declared his own theory inapplicable to this special case.

    Practical attempts at control

    While the arguments of Keynes, Hanse and Galbraith were all convincing on their own terms, they all proved impractical in reality. At the time when Galbraith caught the attention of the economics profession with his bold argument in favor of greater price controls, Leon Henderson was heading the newly created Office of Price Administration (OPA). He was a prominent economist in the Roosevelt administration, and his approach to economic policy “had the characteristic New Deal qualities of public activism, brash experimentalism.”27Bartels, A. H. “The Office of Price Administration and the Legacy of the New Deal, 1939–1946.” (<)em(>)The Public Historian(<)/em(>), 1983: 5(3), 8. Henderson had become involved in attempts at price stabilization when the prices of raw materials and industrial goods shot up after the German invasion in Poland, which he thought would impede the recovery of the American economy still suffering from the Great Depression.28Bartels, “The Office of Price Administration,” 7-8 When the United States entered the Second World War in December of 1941, Henderson immediately pushed for far-ranging controls to stabilize prices during the war effort and to prevent a boom–bust cycle upon its end.29War Records Section Bureau of the Budget. “The United States at War: Development and Administration of the War Program by the Federal Government.” Washington, DC: United States Government Printing Office, 1946, 239-40. Conscious of Galbraith’s writing, Henderson decided to offer him what would come to be called “the most powerful civilian post in the management of the wartime economy.” Galbraith was put in command of all prices of the United States.

    Thus began “the longest and most comprehensive trial [of price controls] in America’s history.”30Rockoff, H. (<)em(>)Drastic Measures. A History of Wage and Price Controls in the United(<)/em(>) (<)em(>)States(<)/em(>). (Cambridge: Cambridge University Press, 1984), 85. The American price-fixers had to defend their selective price schedules on multiple fronts. They had to debate the high-powered economists with their theoretical considerations, negotiate fiercely with the industry bosses, and fight to be granted the necessary legal power from Congress. Yet, to the surprise of the price-fixers, for those commodities for which they published specific price schedules, the ceiling prices were well observed even before penalties could be imposed.31Galbraith, (<)em(>)A Life in Our Times(<)/em(>), 136, 164 By the fall of 1941, their informal controls effectively restrained about 40 percent of wholesale prices.32Bartels, “The Office of Price Administration,” 9 But the task of determining commodity-specific prices for all relevant products, while allowing for a degree of flexible price adjustments, proved impossible.

    The price-fixers were challenged by the complexity of input-output relations and “began to realize for the first time what an unreasonably large number of products and prices there were in the American economy.”33Galbraith, (<)em(>)A Life in Our Times(<)/em(>), 164 Further, they had overlooked the importance of “wage–push inflation.” 34Galbraith, (<)em(>)A Life in Our Times(<)/em(>), 142 The OPA, in line with the New Deal legacy, remained committed to the cause of the poor, the workers, and the farmers and initially tried to abstain from wage controls and strict price controls for agricultural goods. A mutually reinforcing upward pressure on wages as employment was expanding and, as a result, also drove up agricultural and industrial prices. This proved to be a great challenge to the effort of price stabilization.35Bartels, “The Office of Price Administration,” 10-12

    Despite the OPA’s efforts, consumer prices had risen by 11.9 percent, and wholesale prices by 17.2 percent, from April 1941 to 1942 alone.36Rockoff, H. (<)em(>)Drastic Measures. A History of Wage and Price Controls in the United(<)/em(>) (<)em(>)States(<)/em(>). (Cambridge: Cambridge University Press, 1984), 109. This immediate inflationary pressure was much higher than most economists had expected at the beginning of the war. As a result, the OPA and Galbraith became amenable to the ideas of Bernard Baruch.

    Baruch’s voice was very different from that of most of the professional economists. Born in 1870, he had become rich in his early years on Wall Street and had gained influence as a political advisor to President Woodrow Wilson. He became chairman of the War Industries Board during the First World War and, as such, was also a member of the Price-Fixing Committee. Baruch experienced the challenges of controlling inflation firsthand. 37 Baruch, B. (<)em(>)The Public Years(<)/em(>). (New York: Holt, Rinehart and Winston, 1960). He lobbied for an overall price freeze in the Second World War. Instead of selective price controls, he believed that all prices should be pegged where they stood. This became known as the Baruch Plan. 38 War Records Section Bureau of the Budget. “The United States at War: Development and Administration of the War Program by the Federal Government.” Washington, DC: United States Government Printing Office, 1946, 237-238.

    Henderson, Galbraith, and their team, joined by celebrated economists such as Irving Fisher, had initially lobbied against the Baruch Plan. But about a year into Galbraith’s work at the OPA, they had to admit that their own attempt at scientific price-fixing had failed to prevent the price level from rising rapidly. 39 Galbraith, (<)em(>)A Life in Our Times(<)/em(>), 164; Rockoff, (<)em(>)Drastic Measures(<)/em(>), 89, 91; Bartels, “The Office of Price Administration,” 13. On April 28, 1942, the General Maximum Price Regulation was imposed under the lead of the OPA. All “prices legally within reach” were set a ceiling that was defined as “the highest charged [price] in March by that seller for the same item” 40 Galbraith, (<)em(>)A Life in Our Times(<)/em(>), 165 , and wages were brought under government control. 41 Rockoff, (<)em(>)Drastic Measures(<)/em(>), 92 The new policy was based on given prices observed in the market within a certain time span, rather than trying to determine abstractly what the price for each commodity should be.

    The General Maximum Price Regulation was more effective than selective controls, but it failed to stabilize the overall price level sustainably due to a lack of control over wages and agricultural prices. Following Henderson’s initiative, Roosevelt finally received backing from Congress for legislation to freeze farm prices at parity and to stabilize wages in September of 1942.42Bartels, “The Office of Price Administration,” 15–16 This proved unpopular with both workers and farmers and caused severe losses for the Democrats in the congressional elections. As a consequence, Henderson had to resign.

    On April 8, 1943, President Roosevelt issued an executive order to force an effective general price freeze. This policy was called “hold the line” and enforced that no “further increases in prices affecting the cost of living or further increases in general wage or salary rates” would be tolerated, “except where clearly necessary to correct substandard living conditions.”43Roosevelt, as cited in Rockoff, (<)em(>)Drastic Measures(<)/em(>), 85

    With the executive backing of the “hold-the-line” order—and thanks to a great popularization effort to make dollar-and-cents price ceilings known to sellers and consumers—the OPA, under Henderson’s successors Prentiss Brown and Chester Bowles, managed to halt inflation. The annual Bureau of Labor Statistics living cost index increased by less than 2 percent annually between spring 1943 and April 1945, or one-sixth the rate of the preceding two years.

    The outcome of wartime controls

    The benchmark for the OPA’s work was to achieve greater price stability and higher output growth than occurred during the First World War. Year-by-year comparisons of the macroeconomic performance during the Second World War, relative to that of the First World War, were a common tool for evaluation as well as a public demonstration of the effectiveness of price controls.44Mansfield, H. C. (<)em(>)Historical Reports on War Administration: A Short History of OPA(<)/em(>). (Washington, DC: Office of Temporary Controls and Office of Price Administration, 1947), 82. At the end of the Second World War, the Harvard economist Seymour Harris delivered a careful empirical analysis of the detailed workings of price controls in the United States; his analysis documents the comparatively superior stabilization record in the Second compared to the First World War. Harris suggests that “the most significant test of the success of any price-control program is its effects on production”45Harris, S. E. (<)em(>)Price and Related Controls in the United States(<)/em(>). (New York: McGraw-Hill Book Company, 1945), 11 (see Figure 2.2). As they were slowly put in place in the later years of the war effort, the partial price controls of the First World War did help to some extent to stop inflation from rising further. Nevertheless, the experience of the First World War was one of inflation under lose price controls, while production stagnated; in the Second World War, price controls became strict, price rises were low, while the increase in output was almost beyond imagination.

    In contrast with Keynes’s assumption of a fixed “size of the cake” during wartime, the gross national product (GNP) of the United States almost doubled from 1940 to 1944: private capital formation declined but was more than compensated for by a dramatic expansion of government expenditures and a slight increase in consumer expenditures (see Figure 2.3). Instead of crowding out private expenditures, government expansion drastically increased the size of the cake.

    The consumption of durable goods such as automobiles and furniture declined, but personal savings rates more than tripled during the Second World War, from the prewar level of about 6 percent of GNP to more than 20 percent in the years 1942–1944.46Brunet, G. (<)a href='https://berkeley.app.box.com/s/5fwkm24om69xvbzowvEaepg5jx79yo3c'(>)Stimulus on the Home Front: The State-Level Effects of WWII Spending(<)/a(>), 2018, 33; Goldsmith, R. W. (<)em(>)A Study of Saving in the United States(<)/em(>). (Princeton: Princeton University Press, 1955), 62-65. Personal savings, which peaked at about USD 30 billion in 1945, were critical to closing the gap between the growth in purchasing power and that in the supply of consumption goods.47Goldsmith, (<)em(>)A Study of Saving(<)/em(>), 63; Mansfield, (<)em(>)Historical Reports(<)/em(>), 57 In the context of an increasing supply of consumption goods, effective rationing of scarce goods, and extremely high saving rates, black markets were by far not as pervasive as many had predicted, and quality deterioration was limited to a few products.48Harris, (<)em(>)Price and Related Controls(<)/em(>), 267; Galbraith, (<)em(>)A Life in Our Times(<)/em(>), 171; Mansfield (<)em(>)Historical Reports(<)/em(>), 44-45 At the same time, corporate profits might not have skyrocketed in the ways some business leaders had hoped, and the profit rate fell during the war. But annual profits after taxes still more than doubled from 1939 to 1943, from USD 4 billion to USD 8.5 billion, as a result of the rapid expansion of GNP.49Harris, (<)em(>)Price and Related Controls(<)/em(>), 27

    In 1952, Galbraith wrote A Theory of Price Control to summarize his reflections on the workings of price controls. He argued:

    [T]he strategy of control must involve a two-way move. Along with the controls over the growth of income from the side of taxation and savings there must be direct market controls. On this side the role of price control per se … is strategic. No more than the economist ever supposed will it stop inf lation. But it both establishes the base and gains the time for the measures that do.50Galbraith, (<)em(>)A Theory of Price Control(<)/em(>), 258

    The postwar transition

    On August 15th, 1945, Japan announced its surrender; on the 18th, the new President of the United States, Harry S. Truman, issued an executive order “for the orderly Modification of Wartime Controls.”51Truman, H. S. (<)a href='http://www.presidency.ucsb.edu/ws/index.php?pid=77920'(>)Executive Order 9599(<)/a(>). (August 18, 1945). Retrieved April 30, 2017. It stated the aim to “move as rapidly as possible without endangering the stability of the economy toward the removal of price, wage, production and other controls and toward the restoration of collective bargaining and the free market.”

    As part of this order, direct wage controls were removed.52Rockoff, (<)em(>)Drastic Measure(<)/em(>)s, 99 Truman was aware of the dangers of a hasty price increase as a result of decontrol, but he hoped to be able to relieve the direct controls and “hold the line” through voluntary cooperation with business leaders and trade unions.53Truman, H. S. (<)em(>)Memoirs of Harry S. Truman. Vol. I: Year of Decisions 1945(<)/em(>). (London: Hodder and Stoughton, 1955), 423-424. When this failed, he changed course and sought support against a policy of decontrol.

    Truman was not alone. In 1946, fifty four economists published a letter in the New York Times urging the extension of the Price Controls Act for another year. Opinion polls showed that the general public also strongly supported the plan of keeping price and wage controls.54Rockoff, (<)em(>)Drastic Measure(<)/em(>)s, 101 But the eventual bill extending the price control contained so many “crippling amendments” that on June 29, Truman vetoed it, hoping for a bill that would keep price and wage controls in place more effectively. Such a bill never passed. As a result, wartime price controls reached an abrupt end.

    The sudden end to almost all price controls did, in fact, cause the inflationary rise in prices as the President, the OPA staff, and the letter by economists had predicted (see Figure 2.1). Some key input commodities, such as steel scrap, copper, tin, and rubber, still had their prices set by the government, and rents, sugar, and rice remained controlled. But, irrespective of this, prices rose rapidly after the failure to renew the Price Control Act.

    Michael Kalecki analyzed postwar inflationary tendencies in the United States and other countries on behalf of the United Nations Department of Economic Affairs. He showed that, in particular, the prices of essential raw materials and foodstuff, for which the respective demand by producers and consumers is inelastic, shot up.55Kalecki, M. (<)em(>)Inflationary and Deflationary Tendencies, 1946–1948(<)/em(>). (New York:United Nations Department of Economic Affairs, 1949), 38. Wage increases did not compensate for the increase in the cost of living, so price decontrols resulted in a decline in real incomes for workers. Real labor incomes had declined 8 percent by the first half of 1947, as compared with the first half of 1946.56Kalecki, (<)em(>)Inflationary and Deflationary Tendencies(<)/em(>), 39 At the same time, profit margins increased, and there was a shift of gross private income from labor to capital. In the course of the war, labor had increased its share. By the first half of 1946, labor still accounted for 61.5 percent, which declined to 58.8 percent by the first half of 1947. Conversely, gross corporate profits rose from 11.6 to 14.0 percent.57Kalecki, (<)em(>)Inflationary and Deflationary Tendencies(<)/em(>), 40 The rapid decrease in workers’ purchasing power, the redistribution of income, and the devaluation of their wartime savings unleashed the greatest wave of labor strikes of the US postwar decades.58Hibbs, D. A. “On the Political Economy of Long-Run Trends in Strike Activity,”(<)em(>)British Journal of Political Sciences(<)/em(>), 1976, 160; Richter, I., and D. Montgomery. (<)em(>)Labor’s Struggles, 1945–1950: A Participant’s View(<)/em(>). (Cambridge: Cambridge University Press, 1994), 48-50. The immediate postwar years saw a short, inflationary boom paired with labor unrest, followed by a sharp downturn. The United States thus experienced the boom–bust cycle Truman had feared.59 Rockoff, (<)em(>)Drastic Measure(<)/em(>)s, 109 Yet, a Great Depression was avoided, possibly thanks to spending for the Korean war.

    Pragmatic prices

    In “Reflections on the Invisible Hand,” mathematical economist Frank Hahn warned that both those believing in the omnipotent power of the visible and the invisible hand “take it for granted that somewhere there is a theory, that is a body of logically connected propositions based on postulates not wildly at variance with what is the case, which support their policies.” 60 Hahn, F. “(<)a href='https://warwick.ac.uk/fac/soc/economics/research/workingpapers/1978-1988/twerp196.pdf'(>)Reflections on the Invisible Hand(<)/a(>),” in Fred Hirsch Memorial Lecture. University of Warwick.  During the Second World War, even the self-declared pioneer of free enterprise, the United States, retreated to a pragmatic approach in its use of the visible hand and controlled, among other things, most prices and wages to finance the war while achieving low inflation. Not only had the ideal of the invisible hand been abandoned, but, more fundamentally, it had been acknowledged that there is no such “theory, that is a body of logically connected propositions” that serves to draw up a comprehensive blueprint for economic policy. Instead, one had to apply “the wishy-wash, step by step, case by case approach,” which Hahn recommended as “the only reasonable one in economic policy.” In our current moment of crisis and instability, we would do well to heed this advice.

  9. Odious Debts

    Comments Off on Odious Debts

    In the aftermath of its 2003 invasion of Iraq, the United States was eager to restructure the ailing country’s sovereign debt. International sanctions since the Gulf War meant that Iraq was economically isolated, yet the country had a large stock of unpaid debts issued to governments, financial institutions, and commercial trading partners that dated back to its weapons purchases during the 1980 Iran-Iraq war. 

    In the early 2000s, Iraq was the most indebted nation in the world, with a debt totaling 573 percent of GDP. This debt, and the war it financed, transformed it from a prosperous nation to a war torn, insolvent one in just a few years. Scandals surrounded Iraqi creditors, who were charged with everything from illicit money flows to covert weapons sales. In the long run, this debt was a significant obstacle to international trade. In the absence of restructuring, old creditors could attach commercial or sovereign assets to recoup their money, as they had in cases of earlier defaults. 

    The Iraqi debt stock is a glaring example of “odious” or illegitimate debt—a notion that dates back to the 1898 peace negotiations of the Spanish-American War. Back then, the Americans claimed that neither they nor the Cubans were responsible for Cuba’s outstanding sovereign debt. Rather, they argued, since the debt had been forced on Cuba by Spanish colonial rulers, it should be understood as illegitimate. 

    Since then, there have been attempts to define an explicit legal doctrine of legitimate debt, but the adoption of such a doctrine has remained rare in international negotiations. Today, the notion of odious debt is best thought of as a principle rather than a defined set of international laws. It holds that debt issued without public consent and serving no public purpose at the time of issuance ought not to be inherited by successive governments. This, however, runs against key tenets of international law, which maintain that debt issuance depends on the apolitical durability of obligations. 

    But even within the existing international framework, countries do not always pay back their debt. The number of sovereign-debt defaults and restructurings have been increasing alongside debt levels. Debt crises are still dealt with on an ad-hoc basis, and the international monetary system is unprepared for the cluster of economic and political crises that continue to unfold. In this context, the notion of odious debt gains renewed urgency—both in conceptualizing sovereign debt crises, and in combating their severe consequences. Iraq and Haiti present two key examples.

    Restructuring Iraqi debt

    Iraqi sovereign debt was issued to fight a geopolitical war which bore little relevance for the vast majority of Iraqis. By the US invasion in 2003, there was a strong case not only to restructure the debt, but to simply write it off. This was the position of many grassroots groups who called for a debt jubilee. Surprisingly, it’s a proposal that even received support from the Department of Defense and the White House, institutions that rarely interfere in issues of sovereign-debt management. While the US government never put forward a coherent view, many US officials recognized that success in Iraq depended on its integration in international trade. 

    Though they don’t follow a template, sovereign-debt restructurings always include distinct players: the debtor country’s government, normally represented by the finance minister or central bank governor, aims to streamline the process and maximize relief. On the creditor side is a patchwork of committees: Western countries negotiate collectively in the Paris Club, while commercial creditors tend to form working groups based on industry, geography or type of claim. Bankers and lawyers represent each group, and the IMF provides credibility (debt sustainability analyses and balance of payment data) as well as bridge financing. In the Iraqi case, the US Treasury was heavily involved in discussions thanks to the US government’s political engagement. 

    Despite the moral and economic justification for debt cancellation, the IMF, finance ministries around the world, lawyers, and bankers all had an incentive to resist the invocation of odious debt for two reasons. First, it would upset the normal order of sovereign-debt restructurings, potentially rendering other debt claims subject to dispute. Second, in the case of Iraq, political backing from the US meant that a normal debt restructuring could be done swiftly and powerfully. 

    The global financial community argued that a standard restructuring would be easier than developing a new doctrine. Because there was powerful political backing from the coalition governments to write off Iraqi debt, they turned out to be right—the subsequent restructuring was successful, and Iraqi debt was reduced by almost 90 percent in net present value terms. Most governments signed off, and commercial creditors accepted the deal. The agreement offered a 20 percent return of nominal claims plus interest. Because the debt was so old at the time of restructuring, interest had accumulated and creditors received high returns. Loans which had been written off were held at the same rate on balance sheets as non-performing loans. 

    The standard restructuring allowed creditors to settle their debts and avoid the uncomfortable questions surrounding its issuance. Crucially, however, the Iraqi government was not at the table. The case demonstrates the complexities in officially recognizing a debt as illegitimate—even if odious debt is identified and agreed upon, the political will to write it off tends to be lacking. 

    Haiti’s independence debt

    Between 1825 and 1950, Haiti paid 150 million francs to France. In the wake of the slave revolt that led to Haiti’s declaration of independence in 1804, the fledgling former colony was forced to pay an enormous “indemnity” fee to its former oppressor. It was also obliged to give preferential treatment to French exports. To repay its creditors, Haiti had to borrow extensively from French banks, ensuring its indebtedness for generations. War reparations are normally imposed by the victor, but in the case of Haiti, a different logic prevailed. Rather than the Haitian people or government demanding reparations from their former French masters, it was France that sought compensation for the loss of its former colony and slaves. According to an estimate by Kim Oosterlinck, Ugo Panizza, Mark Weidemaier, and Mitu Gulati, the indemnity payments were equivalent to 270 percent of Hatian GDP. 

    Though Haiti had won its independence, it was quickly crushed by foreign debt. The exorbitant sums crippled the Haitian economy, hampering domestic and foreign investment, while cementing the status of a small elite. Oosterlinck and coauthors calculate that had the indemnity been invested with a real return of 1 percent since 1825, it would be equivalent to 22 percent of Haitian GDP today. 

    Today, Haiti is one of the poorest nations in the world, and calls for reparations are growing. Before the 2004 overthrow of President Aristide, Haiti prepared a lawsuit against France for restitution of the debt. The claim was and is substantial; the indemnity and associated loans were not made for the benefit of the Haitian people, but for that of Parisian bankers, French exporters, and (later) New York banks. Haitian elites gained recognition of their property rights, but the vast majority of Haitians suffered. 

    The cases of Iraq and Haiti illuminate the persisting importance of odious debt, from colonization to modern day warfare. In Iraq, creditors lent money for weapons purchases, financing a war fought on someone else’s behalf. In Haiti, French gunboats were situated outside the capital until the indemnity agreement was signed, ensuring deep indebtedness for generations. In both cases, coercion and force were central to the imposition of odious debt burdens. As with other cases, a small cadre of elites benefitted from the loans, but they never reached the broader public. 

    What comes next?

    The issue of odious debt puts forward a fundamental question: how do we design a system in which corrupt loans can be written off, without destroying the foundations for sovereign-debt lending altogether? It’s been almost twenty years since the Iraqi sovereign-debt restructuring, but no progress on detailing a usable doctrine has been proposed. Similarly, over 200 years after the imposition of its independence debt, Haiti has halted efforts to bring a claim against France. If these two egregious cases of odious debt cannot be used as the basis for reform, there seems to be little hope of tackling the problem of illegitimate debt. 

    Central to devising an odious debt doctrine is ensuring the ability to distinguish between illegitimate and legitimate debts. Not all loans should be at risk of being called illegitimate—debtors’ ability to tear up loan agreements without proper justification would pose a problem for the sovereign debt market overall. Bond contracts are written with cross-default provisions on a country’s “external indebtedness,” often governed by English or New York law. If a country chooses to default on one creditor, then it almost always results in an automatic default on all other creditors as well. This means that if a country borrowed money from a bank to build torture facilities for dissidents of its previous regime, but also borrowed money from a pension fund to build windmills, it is then difficult to pay back the pension fund but not the bank. Reform is clearly needed in this regard. Recognizing odious debts would mean that a court could designate the loan to build torture facilities as illegitimate, thereby allowing the country to renege on a specific loan and remain in good legal standing without any second-order contractual problems. 

    But even this reform faces major political obstacles. Powerful agents in the global economy have no interest in developing a working doctrine of odious debt; many investors and banks have given loans to corrupt regimes and despots, and creditors like to be repaid. A norm that relies on the Paulie Rule of repayment is obviously a norm that creditors want to maintain. So far, very few sovereign-debt restructurings have involved any discussion of the moral dimension of paying creditors. But as the global debt crisis worsens in the coming years, such considerations are likely to become indispensable. 

  10. Development Engines

    Comments Off on Development Engines

    In December 2021, President Joe Biden announced a proposed consumer tax incentive for electric vehicles (EV) made in the US by unionized autoworkers.1With this proposal, Biden laid down the path to achieve three goals of his now stalled “Build Back Better” agenda: 1) promote a carbon pollution-free power sector by 2035, 2) create jobs with labor protections, and 3) strengthen the US auto industry with technology invented in America. The tax incentive promises to support the transition to “green technologies,” curtail dependence on fossil fuels, and “decarbonize” the economy, while strengthening collective bargaining after decades of state-led efforts to weaken unions.

    Unsurprisingly, the proposal encountered opposition. In the US, Honda, Kia, Nissan, Hyundai, and Tesla opposed the bill on the basis of its union-made incentive; it only benefits Ford, General Motors, and Chrysler—Detroit’s Big Three whose workforces are famously unionized. If the concern is climate change, business analysts asked, why not expand the credit to companies that are already manufacturing electric cars? The incentive also sparked accusations of protectionism. The Mexican government argued that a tax incentive contravenes the USMCA trade deal “by granting undue advantage to US-built vehicles.” Since the EV tax credit is a type of subsidy, it goes against World Trade Organization rules. The European Commission also opposed the incentive, arguing that it discriminates against EU car and car-component manufacturers, which employ 420,000 workers within the US.

    The row over the EV tax incentive exposed the tensions between domestic policies and free trade rules in a highly integrated regional economy. Policies to secure jobs for a particular workforce potentially make jobs even more uncertain for other workforces employed in the North American automotive sector. This includes Mexico, where the automotive sector represents 20 percent of GDP.

    Prior to the North American Free Trade Agreement (NAFTA), Mexico’s automotive sector was directed by domestic policy. National and local policies aimed to  build a capital- and labor-intensive manufacturing sector, thus serving as a source of job creation. This changed in the 1990s. With the formation of the North American geo-economic region in 1994, car production came to implicate foreign policy, trade agreement rules, transnational corporations, and international unions. Today, car production is far more complex than simply setting up a factory in a particular locale. Tracing Mexico’s automotive industry over six decades illuminates how the North American automotive sector of the present combines local, domestic, and global interests, each carrying distinct consequences for labor, industrial policy, and now, climate strategy.

    Building Mexico’s automotive sector 

    In a bid to spur industrial development, in 1962 the Mexican government decreed that 60 percent of each car sold in Mexico must be manufactured domestically.2Since the 1920s, Mexico had assembled Ford and General Motors cars, initially manufactured in Detroit and exported as completely-knocked-down (CKD) kits. Jorge Acevedo Martínez and Armando Heredia González, “Historia de la Ford Motor Company de Mexico, SA de CV.” In (<)em(>)La Cultura Industrial Mexicana(<)/em(>). Sergio Niccolai and Humberto Morales (eds.). Pp. 387-397 (Puebla: Benemérita Universidad Autónoma de Puebla, 2003). This required multinational automobile corporations partnering with local businesses to establish car factories, strengthening Mexico’s oligarchy while developing the domestic car industry.3For a detailed account and analysis of the policies that shaped the Mexican automotive industry during the ISI era, see Douglas C. Bennett and Kenneth Evan Sharpe, (<)em(>)Transnational Corporation versus the State: The Political Economy of the Mexican Auto-Industry(<)/em(>) (Princeton, NJ: Princeton University Press, 1985). See also Rhys Owen Jenkins, (<)em(>)Dependent Industrialization in Latin America: The Automotive Industry in Argentina, Chile, and Mexico(<)/em(>) (New York: Praeger, 1977). A national automobile industry was integral to Mexican industrialization, as car production was closely linked to the iron, steel, rubber, plastic, glass, and oil industries.4Edur Velasco Arregui, “Industrial Restructuring in Mexico During the 1980s.” In (<)em(>)The Political Economy of North American Free Trade(<)/em(>). Ricardo Grinspun and Maxwell A. Cameron (eds.). Pp. 163-175 (Montreal & Kingston: McGill-Queen University Press, 1993).    

    Domestic policies gave preference to industry over small-scale agricultural production. State-led industrialization via the economic model of import-substitution industrialization (ISI) benefited car corporations by way of protectionist policies, tax concessions, and infrastructure (such as highways). The government also gave manufacturers cheap access to land expropriated from peasants, as it considered factories to be of public interest. Volkswagen Mexico, located in Puebla, 81 miles south of Mexico City, benefited from three such land expropriations.5Manlio Barbosa Cano, “El decreto expropiatorio de las tierras de Ocotlán es contrario al interes público.” (<)em(>)Crítica Revista de la Universidad Autonóma de Puebla(<)/em(>) (1984,21:55-65) and Elsa Patino Tovar, “Periferia Poblana: la desigualdad del crecimiento.” (<)em(>)Papeles de Población(<)/em(>), Universidad Autonóma del Estado de México (2004 10(2): 125-151).The state also played a major role in directing production: in 1969, for example, the government required car companies to increase their exports to balance out the imported content of their vehicles.6Douglas C. Bennett and Kenneth Evan Sharpe, (<)em(>)Transnational Corporation versus the State: The Political Economy of the Mexican Auto-Industry(<)/em(>) (Princeton, NJ: Princeton University Press, 1985).

    The automotive industry propelled the rise of a waged, skilled, and mostly male working class in Mexico. The industry’s development in the 1960s coincided with the rise of state-provided social services and infrastructure—public healthcare, credit for buying houses, and subsidized food stores—which were geared toward autoworkers and their dependents. Whereas public education is a right based on citizenship, healthcare and credit for housing are only accessible to those formally employed in the public or private sectors.7Subcontracted workers employed in both sectors were, until 2021, excluded from these legal entitlements granted in Mexico’s labor code. See Alejandra González Jiménez, “(<)a href='https://nacla.org/mexico-labor-reform-outsourcing-autoworkers'(>)Mexico’s Labor Reform May not be Enough for Auto Logistics Workers(<)/a(>).” This system of public services supplanted low wages—workers regularly worked double or triple shifts in order to meet the cost of living—but still enabled autoworkers’ social mobility. The social safety net had a clear preference for industrialized workers over other sections of the working class, such as peasants. Under ISI, corporations, state-owned companies, and a mostly male industrial workforce in the oil, automotive, and electric sectors benefited from national policy.

    Labor had little influence over industrial policy. Since the 1930s, state-allied unions have dominated Mexico’s labor movement, and when it came to the automotive industry, they endorsed contracts that primarily served company interests and deterred any labor unrest that resulted. Independent unionism emerged in the automotive sector in the 1970s, encouraging internal union democracy and union control over the labor process at the factory level, but these unions were excluded from the policy debates that concerned the automotive sector.8Ian Roxborough, (<)em(>)Unions and Politics of Mexico. The Case of the Automobile Industry(<)/em(>) (Cambridge: Cambridge University Press. Nevertheless, organized labor gained victories during during pro-labor governments.9Joseph U. Lenti, (<)em(>)Redeeming the Revolution(<)/em(>) (Lincoln: University of Nebraska Press 2017).

    In the 1970s, Mexico shifted from ISI to an export-oriented industrialization (EOI) strategy. Factories owned by transnational corporations known as maquiladoras still benefited from the ISI practice of providing facilities to companies moving to Mexico. What changed, however, was that at maquiladoras, the materials brought from the US were assembled in Mexico, and then exported back to the US for sale.10These jobs mostly targeted a female workforce. See more on the gendered dimension of (<)em(>)maquiladora (<)/em(>)manufacturing sector: Norma Iglesias Prieto, (<)em(>)Beautiful Flowers of the Maquiladora(<)/em(>) (Austin: University of Texas Press 1997) and Patricia Fernández-Kelly, (<)em(>)For We are Sold, I and my People: Women and Industry in Mexico’s Frontier(<)/em(>) (Albany: State University Press, 1983). The rise of EOI was simultaneous with austerity measures imposed by the IMF in the aftermath of Mexico’s debt crisis in the 1980s. As a result, in the 1980s and 1990s, Mexico cut state subsidies, privatizing state enterprises, education, and healthcare. Domestic policy moved towards the creation of low-paying jobs contingent on market conditions and simultaneously undoing the system of social services that defined the ISI era. 

    The NAFTA shift

    Although the development of an export-oriented strategy de facto ended ISI through the 1970s, it was only formally terminated by decree in 1989, in order to create a legal structure for NAFTA at the national level. At the time of signing in 1992, NAFTA created the largest free trade zone in the world, part of an emergent multilateral trade order in which free trade agreements effectively wrote the “constitution of a single global economy.” By this point, the maquiladora model dominated the auto industry.11Teresa Healy, (<)em(>)Gendered Struggles Against Globalisation in Mexico(<)/em(>) (Aldershot: Ashgate 2008). NAFTA and the introduction of just-in-time production in the automotive sector lowered costs by increasing flexible specialization. The industry was thus fragmented into three sharply differentiated processes: auto-parts manufacturing, distribution, and car assembling.12Deborah Cowen, (<)em(>)The Deadly Life of Logistics: Mapping the Violence of Global Trade(<)/em(>). Minneapolis: University of Minnesota Press 2014).

    So-called just-in-time drastically restructured production and labor. Car factories continued to do assembly but otherwise outsourced much of the production process to hundreds of companies that handled auto-parts manufacturing, distribution, and tasks only indirectly connected to car production, such as janitorial and cafeteria services, and the preparation of cars for shipment. Today, the segments in the production chain that employ the largest workforces are manufacturing and distribution. The production practice has opened the door to increased labor flexibilization and precaritization: during the past ten years, industrial robots—requiring no human operator—have slowly displaced autoworkers. According to a 2018 report by Stephen Woodman for the Center for International Governance Innovation, “In 2011, there were 83 Mexican autoworkers to every one robot.… By 2015, the ratio had dropped to 19 to 1.”  

    With the implementation of just-in-time production, independent unions lost control over the production process, especially in their ability to influence production rates, promotion procedures, and employment security. At the national level, independent unions and their state-allied counterparts lost their already constrained role in negotiating agreements,13Kevin Middlebrook, “Union Democratization in the Mexican Automobile Industry: A Reappraisal.” (<)em(>)Latin American Research Review(<)/em(>), 1989(<)em(>) (<)/em(>)24(2):69-93. though independent unions were more likely to strike. 

    Nevertheless, Mexico’s automotive sector is often considered a major success of NAFTA. The automotive sector has indeed generated employment and increased the labor participation of a younger generation, absorbing it into the ranks of the formal economy. The post-NAFTA era has led to new employment opportunities in engineering, administration, and management. In areas with a high concentration of transnational corporations, local policies attempt to prepare aspiring workers for the standardized test required for employment. Local governments also pay a small bonus to companies to send Mexican workers abroad for training. High-paying jobs, however, are not created at pace and the majority of the jobs created by the automotive sector remain low-paying and precarious. 

    ISI laid the foundation for a development model dependent on private corporations for wage labor and the state for land expropriation, and NAFTA consolidated this model. Under NAFTA, the Mexican government continued granting tax exemptions and incentives to entice automotive investments.14(<)a href='https://automotivepolicy.ca/wp-content/uploads/2018/05/promexico-aprc-report-final.pdf' target='_blank' rel='noreferrer noopener'(>)These practices are also found in the US and Canada(<)/a(>). Federal and state governments have given millions of dollars to Toyota, Kia, Mazda, Honda, Volkswagen, Audi and Pirelli, a multinational tire manufacturer, according to a 2016 report prepared by the Automotive Policy Research Center. Kia and Audi also received land donations from the government—533 hectares and 460 hectares respectively. In Nuevo Leon, the government allocated Kia US$115 million in direct incentives, a 20-year waiver for a payroll tax, and US$197 million in infrastructure spending to support the installation of the plant. The land for Audi’s factory, an industrial park that houses its suppliers, and a new city next to the factory, was expropriated from peasants. Along with land, car factories receive unprecedented amounts of water, diverted from peasants to Mexico’s car economy.  

    At the national level, corporations remain key players of socioeconomic development. They are the main providers of wage labor, and therefore access to healthcare and housing. Corporations had similar dominance over wage labor under ISI, but during this era the Mexican state had a greater role in delineating industrial policy. At a global scale, corporations exercise a power granted by the laws structuring and regulating free trade. NAFTA was the first trade agreement to establish the investor-state dispute settlement (ISDS) allowing investors to sue a country for “breaching obligations” and causing damages to investors as a result.15Using this clause, corporations sue countries for passing environmental protections under the argument that these disrupt their operations, current investments, (<)em(>)and (<)/em(>)undermine their expected future profits. For more on corporate power see Joshua Barkan, (<)em(>)Corporate Sovereignty: Law and Government under Capitalism(<)/em(>) (Minneapolis: University of Minnesota Press, 2013) and Dinah Rajak, (<)em(>)In Good Company: An Anatomy of Corporate Social Responsibility(<)/em(>) (Stanford: University of California Press, 2011). Under NAFTA, the government’s role was in large part to promote investment while keeping labor in check.16In 2007, the then Mexican President Felipe Calderón Hinojosa created (<)a href='https://datos.gob.mx/busca/organization/promexico'(>)ProMéxico(<)/a(>), a subdivision of the Secretariat of Economy, to promote investments in Mexico.

    Labor under the United States-Mexico-Canada Agreement (USMCA)

    In 2020, NAFTA was replaced by USMCA. Unlike its predecessor, USMCA addresses labor issues directly, with broad effects for labor and organizing in Mexico. Chapter 23 of the agreement includes a mechanism to enforce workers’ individual and collective rights, which has already had positive effects for workers. In 2021, the Mexican government was asked to review potential labor rights violations in a GM factory in Silao and an auto-parts factory in the border city of Matamoros. In February 2022, GM workers elected a new independent union in northern Mexico. UAW President Ray Curry voiced his support for the victory, along with Unifor, Canada’s largest private-sector union.17For an example of cross-border solidarities among Mexican, Canadian, and US autoworkers see “$ (<)a href='https://www.youtube.com/watch?v=2AYs8HA6DwQ'(>)4 a Day? No Way! Joining Hands Across the Border(<)/a(>). USMCA also includes a clause to improve wages, requiring that “40–45 percent of auto content be made by workers earning at least $16 per hour.” While promising in theory, it is not clear how the requirement will work in practice for those on the shopfloor. So far, Jesús Seade Kuri, Mexico’s chief negotiator on the USMCA, declared that the $16-per-hour requirement is being met through the salaries of engineers and administrative staff.18To address labor requirements under USMCA, Mexico legally ended the practice of (<)a href='https://www.jornada.com.mx/2021/04/21/politica/003n1pol'(>)subcontracting in 2021(<)/a(>). Subcontracting, a mechanism through which a third-party provides personnel, had become a common form of employment in Mexico. In the area of car production, the 2021 subcontracting bill will have an effect in the area of auto-parts manufacturing but not in the area of logistics services, as the delivery of auto-parts (along with janitorial and cafeteria services) is not considered (<)a href='https://expansion.mx/empresas/2020/12/10/outsourcing-el-automotriz-pide-tiempo-y-cambiar-reparto-de-utilidades-por-bonos' target='_blank' rel='noreferrer noopener'(>)the core(<)/a(>) of car production.

    USMCA preserves the integration of the automotive sector across Mexico, the US, and Canada that was emblematic of the NAFTA era—a system where, according to a 2021 report from the US Congressional Research Service, “hundreds of suppliers make parts that cross borders seven or eight times before being assembled into a finished car.” Previously, NAFTA required that 62.5 percent of a vehicle net cost and 60 percent of the cost of its parts had to originate in the North American geo-economic region to obtain free-trade benefits. USMCA increases the regional content value to a range of 70 to 75 percent, depending on the vehicle, and divides that content requirement into three groups: core parts, main parts, and complementary parts. Through changing the content values, USMCA extends further into the organization of car production, and makes each country’s automotive sector dependent on one another.

    NAFTA, and now USMCA, have transformed the automotive sector into a significant engine of jobs and economic growth in the three signing countries. By 2020, the sector represented represented 3 percent of US GDP and employed an average of 4.1 million people. In Mexico, it represented US$78 billion in annual revenues and employed over 1 million people across the country, making it the largest manufacturing sector in the country led by original equipment manufacturers (OEMs). In Canada, the sector contributed CAN$12.5 billion to the GDP and employed 117,200 people directly, as well as 371,400 people indirectly. The three countries are among the largest automotive producers worldwide: the United States is the second largest global car producer and the second largest auto-part manufacturer and exporter; Mexico is the sixth and the fifth respectively; and Canada is among the world’s top twelve producers.

    The era of electric cars

    Today, emissions-free cars have opened up a new chapter in the North American automotive sector, but competition around clean energy has challenged the era of free trade. With electric cars seen as a path to curtail fossil-fuel dependence, car manufacturers located in Mexico have pledged to phase out internal-combustion engines and hybrid cars over the next two decades. These promises have led to major investments: Ford invested $420 million in a factory in Cuautitlán which currently assembles electric cars; in April 2022, GM announced a US$1 billion dollar investment to upgrade its factory in Ramos Arizpe, Coahuila to begin manufacturing all-electric vehicles in 2023; in March 2022, the Volkswagen group announced a US$7.1 billion investment to produce battery-electric cars throughout North America. GM also announced a $9 billion investment in its US factories to manufacture electric vehicles or battery cells.19Nevertheless, United Autoworkers (UAW) Vice President Terry reacted to GM’s EV investment in Mexico by describing it as a “slap in the face for not only UAW members and their families but also for US taxpayers and the American workforce.” Volkswagen will upgrade factories on both sides of the border. With these simultaneous investments, corporations seem to be committed to distributing car production throughout the North America corridor rather than move production entirely to a single locale. Auto-part manufacturing in Mexico has also seen a bump in production; in 2019, it produced over US$8 billion worth of electrical automotive parts, an 8.3 percent increase from the previous year. The investments have extended down the supply chain. The Chinese company Ganfeng Lithium, a supplier for Tesla, announced the construction of a lithium-ion battery recycling factory in Sonora. The Chinese corporation Contemporary Amperex Technology Co., (CALT)—the world’s largest producer of EV batteries—is considering investing US$5billion in Mexico, Canada, or the US. The construction of battery production and recycling factories are key for complying with USMCA content requirements, given that, so far, most batteries are manufactured in Asia. 

    For Mexico, the shift to emissions-free cars means an opportunity to regain some control over natural resources that fell out of public hands during the twenty-five years of NAFTA. In March 2022, President López Obrador nationalized lithium—required to produce EV batteries—declaring it to be a “strategic mineral” for Mexico. By nationalizing lithium, the Mexican government aims to building a strong and affordable public energy sector. The announcement was controversial. Kenneth Smith Ramos, who headed the technical negotiations to create USMCA, argued that the bill contravenes USMCA.20To address this concern, the Mexican government has promised to respect the contract of UK’s Bacanora Lithium in partnership with China’s Ganfeng Lithium, with the (<)a href='https://www.jacobinmag.com/2021/10/amlo-morena-cfe-federal-commission-lithium-nationalization-energy-independence' target='_blank' rel='noreferrer noopener'(>)stipulation(<)/a(>) that the concession is in active use, not just for speculation. Katherine Thai, the US Trade Representative, stated that Mexico’s legislation in relation to lithium is “anticompetitive and counter to USMCA protections and provisions” and stymies climate responses by preventing the three signing countries from working together to develop clean energy.

    Biden’s EV tax incentive and López Obrador’s lithium nationalization are evidence of nascent competition between the US and Mexico around billions in potential green investments in the automotive sector. In an era of free trade, however, this competition not only involves granting tax concessions, infrastructure, and the availability of a skilled workforce, it also complicates trade agreement rules. What’s revealed is an uneven field of power relations, shaped by the history of foreign relations and corporate power in each country. 

    Efforts to “re-nationalize” elements of car production demonstrate how the automotive sector negotiates local, national, and global interests—policies aiming to support labor in one country implicate labor and corporate interests in another. Still, there are continuities between the origins of Mexico’s automotive sector and its current state. The Mexican government’s manufacturing-centric growth model, reliance on corporate investment, and divestment from social services have enabled the precaritization increasingly prevalent in the sector today.

    At the same time, a strengthened labor force—as evidenced by recent victories of independent unions—may suggest a potential new direction. USMCA’s chapter 23, along with new labor reforms in Mexico requiring direct union elections and public contracts, have allowed Mexican workers to challenge corrupt unions. Although it remains to be seen how different national interests can be reconciled, shifts in labor legislation across levels of governance are hopeful signs of emerging possibilities in labor unionism.