The financial crises of the 1990s in Asia, Argentina, and Russia sparked interest in the phenomenon of dollarization—the use of a foreign currency to perform national currency functions.1Lin, Shu, and Haichun Ye. 2010. “Dollarization Does Promote Trade.” (<)em(>)Journal of International Money and Finance(<)/em(>) 29 (6): 1124. Dollarization has a long history dating back to the nineteenth history. More recently, a growing body of work has outlined how dollarization limits the independence of monetary policy in host countries and restrains local central banks from acting as lenders of last resort. This research has revealed dollarization’s far-reaching impacts: it causes higher financial fragility, leading to crises during currency depreciation; it eliminates the use of the exchange rate as a policy tool to increase international competitiveness of exports goods and services;2Priewe, Jan, and Hansjörg Herr. 2005. (<)em(>)The Macroeconomics of Development and Poverty Reduction: Strategies beyond the Washington Consensus(<)/em(>). Nomos. and it hinders economic growth.3Yeyati, Eduardo Levy, and Hélène Rey. 2006. “Financial Dollarization: Evaluating the Consequences.” (<)em(>)Economic Policy(<)/em(>) 21 (45): 63–118. These tendencies have only been aggravated in the aftermath of Covid-19, with rising debt levels and deepening asymmetries between the global North and South.
Neoclassical approaches to dollarization depict it as a consequence of financial and macroeconomic instability. But despite improved financial indicators, dollarization rates across the developing world remain high, a phenomenon referred to as dollarization hysteresis.4Duffy, John, Maxim Nikitin, and R. Todd Smith. 2006. “Dollarization Traps.” (<)em(>)Journal of Money, Credit and Banking(<)/em(>) 38 (8): 2073–97; Ize, A., & Levy-Yeyati, E. 2005. “Financial De-Dollarization: Is It for Real?” IMF; Rappoport, Veronica. 2009. “Persistence of Dollarization after Price Stabilization.” (<)em(>)Journal of Monetary Economics(<)/em(>) 56 (7): 979–89; Uribe, Martîn. 1997. “Hysteresis in a Simple Model of Currency Substitution.” (<)em(>)Journal of Monetary Economics(<)/em(>) 40 (1): 185–202; Valev, Neven T. 2010. “The Hysteresis of Currency Substitution: Currency Risk vs. Network Externalities.” (<)em(>)Journal of International Money and Finance(<)/em(>) 29 (2): 224–35; Winkelried, Diego, and Paul Castillo. 2010. “Dollarization Persistence and Individual Heterogeneity.” (<)em(>)Journal of International Money and Finance(<)/em(>) 29 (8): 1596–1618. Understanding this persistence and ubiquity, I argue, requires a deep and qualitative investigation of government decision-making, examining the interests of state actors, domestic and foreign capital owners, and civil societal groups. Though states tend to be excluded from theories of dollarization, they are essential to understanding it both analytically and historically. Currencies are embedded within broader hegemonic struggles of state formation, between domestic and international, state and non-state actors.
The experience of Georgia can shed light on how dollarization is embedded into processes of state-building, development, accumulation, and governance. Georgia represents a classical example of dollarization hysteresis: in 2021, its rate of deposit dollarization reached 60 percent, corporate loan dollarization 70 percent, and household loan dollarization 41 percent. Household borrowers have been most exposed to the risks of foreign currency debt, earning 90 percent of their money in the national currency. Consumer loans and mortgages have long become an inseparable part of daily life, with credit repayment issues leading to foreclosure in most instances. Moreover, 80 percent of the public debt is denominatedin foreign currency. These trends have only worsened with the pandemic—with sharp increases in the ratio of government debt to GDP and government debt service to budget revenues, increased unemployment, and rising poverty levels, non-performing retail loans in foreign currency more than doubled. In what follows, I examine the political foundations of this pernicious monetary arrangement.
Dollarization & state formation
Dollarization first appeared in the colonial context of the nineteenth century, across countries like Egypt, Ghana, Liberia, and Tunisia.5Versal, Nataliia, and Andriy Stavytskyy. 2015. “Financial Dollarization: Trojan Horse for Ukraine?” (<)em(>)Ekonomika(<)/em(>) 94 (3): 21. In the twentieth century, it expanded throughout Latin America, as American policymakers sought to solidify their military and economic expansion.6Feige, Edgar L., Michael Faulend, Velimir Šonje, and Vedran Šošić. 2003. “Unofficial Dollarization in Latin America.” (<)em(>)The Dollarization Debate(<)/em(>), May, 47–71; Guidotti, Pablo E., and Carlos A. Rodriguez. 1992. “Dollarization in Latin America: Gresham’s Law in Reverse?” (<)em(>)Staff Papers – International Monetary Fund(<)/em(>) 39 (3): 518. Throughout the 1990s, it was revived in post-Soviet economies.7Brown, Martin, Ralph De Haas, and Vladimir Sokolov. 2017. “Regional Inflation, Banking Integration, and Dollarization.” (<)em(>)Review of Finance(<)/em(>) 22 (6): 2073–2108; Havrylyshyn, Oleh, and Christian H Beddies. 2003. “Dollarisation in the Former Soviet Union: From Hysteria to Hysteresis.” (<)em(>)Comparative Economic Studies(<)/em(>) 45 (3): 329–57; Luca, Alina, and Iva Petrova. 2008. “What Drives Credit Dollarization in Transition Economies?” (<)em(>)Journal of Banking & Finance(<)/em(>) 32 (5): 858–69.
Following the First World War, “dollar diplomacy” was used to secure American economic and political dominance and the currency’s international role. The 1940s would see a momentary pause in dollarization efforts, as the Federal Reserve, under the leadership of Robert Triffin, advocated capital controls, adjustable exchange rates, and an activist monetary policy.8Helleiner, Eric. 2003. “Dollarization Diplomacy: US Policy towards Latin America Coming Full Circle?” (<)em(>)Review of International Political Economy(<)/em(>) 10 (3): 406–29. With the breakup of Bretton Woods and the transition to floating exchange rates in 1971, however, the dollar reemerged as a cornerstone of the global economy. Susan Strange referred to this change as the “progression from exorbitant privilege to super-exorbitant privilege”9Strange, Susan. 1987. “The Persistent Myth of Lost Hegemony.” (<)em(>)International Organization(<)/em(>) 41 (4): 569. for the United States. The liberalization of currency regimes and capital accounts in the 1970s, as well as the shift to price stability in monetary policy tightened the policy space for dollarized countries, who were forced to choose between currency and price stability.
Thus, the expansion and use of the dollar have always been entangled in a web of geopolitical and economic interests. These interests, however, were not always externally imposed. Understanding the reasoning of dollarized countries is crucial to characterizing the persistence of dollarization and conceptualizing alternatives. Peripheral states seek to strengthen their weak currencies in order to avoid domestic economic outcomes from exchange rate volatilities, expand their capacity for monetary and countercyclical fiscal policies, and strengthen the tools they have for engaging with local interest groups.10Eradze, Ia. 2022. “Financialisation of monetary policy in a dollarised economy: the case of Georgia.” (<)em(>)Cambridge Journal of Economics (<)/em(>)46 (5): 1073-1086. In each of these ways, states act both as vessels for competing interests, and political agents in their own right.
Currencies have been essential to the political calculations of modern nation states since their founding.11Giddens, Anthony. 1985. (<)em(>)Contemporary Critique of Historical Materialism. Vol. 2 Nation-State and Violence.(<)/em(>) Cambridge; Poggi, Gianfranco. 1992. (<)em(>)The Development of the Modern State : A Sociological Introduction(<)/em(>). Stanford/Calif.: Stanford Univ. Pr.; Hobsbawm, Eric J. 1992. (<)em(>)Nations and Nationalism since 1780: Programme, Myth, Reality(<)/em(>). Cambridge: Cambridge University Press; Gilbert, Emily, and Eric Helleiner. 1999. (<)em(>)Nation-States and Money : The Past, Present and Future of National Currencies(<)/em(>). London: New York. By controlling a country’s currency, central banks mediate between states and domestic business interests—both financial and industrial. Central bank policies which alter between price and currency stability have distributional implications for foreign investors, local producers, workers, and households. While export industries can profit from currency devaluations which cheapen their products in the international market, households indebted in foreign currency experience greater difficulty servicing their loans. Likewise, prioritizing price stability through interest rate hikes will slows down economic activity in the real economy.
Mediating between these groups, central banks themselves become contested power players. These tensions are even more pronounced in the periphery, where central bank policies must navigate among the expectations of the IMF, foreign investors, local producers, and governments. Currency policies thus always reflect the outcome of political negotiations. The hegemony of a foreign currency, and especially its use as a primary means of payment, furthermore reflect a consensus among key fractions of the ruling elite, whose interests may deviate from those of society as a whole.
Georgia’s dollarized economy
The development of Georgian dollarization parallels its national independence. The ruble and dollar have dominated the country’s domestic economy since 1991, with the dollarization rate reaching 67 percent in 1994, preceding the issue of the national currency, the lari, in 1995.12de Nicoló, Gianna, Patrick Honohan, and Alan Ize. July 1, 2003. “Dollarization of the Banking System: Good or Bad?” IMF. Dollar domination originated in post-Soviet transition policies, which opened the doors of the Georgian economy to the world market. In the opaque, patrimonial, and bureaucratic Georgian state, the dollar was used as a primary means of payment—serving the interests of rent-seeking political, economic, and financial elites who used it towards bribery and corruption, as well as speculative commercial banks who profited from FX conversions and encouraged dollar deposits via high interest rates. Given the public preoccupation with questions of democracy and human rights, dollarization proceeded largely unnoticed. Even as it recognized the outcomes of dollarization, the IMF denied its relationship to liberalization and placed the burden with the inadequacies of the Georgian state.
These inadequacies were precisely what the Rose Revolution of 2003 was meant to address. Through rolling back the public sector, promoting economic growth, and establishing liberal democratic elections, Georgia was meant to embrace Europe and leave its Soviet past behind.13Cheterian, Vicken. 2008. “Georgia’s Rose Revolution: Change or Repetition? Tension between State-Building and Modernization Projects.” (<)em(>)Nationalities Papers(<)/em(>) 36 (4): 696; Jones, Stephen F. 2006. “The Rose Revolution: A Revolution without Revolutionaries?” (<)em(>)Cambridge Review of International Affairs(<)/em(>) 19 (1): 37; Saakashvili, M. 2004. Mikheil saakashvilis sitkh’va ts’armotkmuli pitsis dadebis tseremoniaze [Inaugural Speech of Mikheil Saakashvili]. (<)em(>)National Library of the Georgian Parliament(<)/em(>). The revolution was successful in many of these efforts—it generally eliminated corruption in everyday life, provided a favorable legal framework for investors, shrunk the bureaucracy, and pursued radical deregulation of economic activity across the board. Under the façade of democratization, however, the post-revolutionary government continued to suppress civil society groups and social movements. Moreover, distributional politics were excluded from the discourse on democracy—GDP grew through foreign direct investment, resulting in lower taxes, a more flexible labor market, and a deregulated financial sector. As finance became one of the fastest growing sectors of the Georgian economy, urban unemployment, poverty, and income inequality persisted and worsened.14Gugushvili, Dimitri. 2017. “Lessons from Georgia’s Neoliberal Experiment: A Rising Tide Does Not Necessarily Lift All Boats.” (<)em(>)Communist and Post-Communist Studies(<)/em(>) 50 (1): 1–14; Rekhviashvili, Lela, and Abel Polese. 2017. “Liberalism and Shadow Interventionism in Post-Revolutionary Georgia (2003–2012).” (<)em(>)Caucasus Survey(<)/em(>) 5 (1): 27–50.
Moreover, despite the economic recovery which followed the Rose Revolution, dollarization rates remained at 70 percent. Under the guidance of the IMF, most Georgian banks came under foreign ownership (more than 50 percent of shares were owned by non-residents). By 2013, nineteen out of the country’s twenty banks were foreign owned. Institutions like the European Bank for Reconstruction and Development, International Financial Corporation, Dutch Entrepreneurial Development Bank, and Deutsche Investitions und Entwicklungsgesellschaft were among the major shareholders in Georgian banks.
The post-revolutionary deregulation of banking activities, development of the judicial system, and improvement of collateral lending practices encouraged commercial banks to issue loans to households in addition to select corporations. With no development banks and foreign currency denominated loans, commercial banks generated rising household debt, import dependence, and vulnerability to exchange-rate fluctuations. Easy access to foreign money encouraged Georgian banks to issue foreign currency loans, where the exchange-rate risk was mostly borne by the borrowers (especially in retail lending). Thus, foreign capital was largely behind the Georgian credit boom of 2005. The credit boom was also enabled by the absence of regulations on foreign currency lending. The abolition of the interest rate ceiling and personal insolvency law, a lack of guidelines around the income-interest rate ratio for borrowers, and uncomplicated procedures for seizing collateral together made it easier for banks to issue loans.
During the credit boom, household debt (consumer loans and mortgages) rose, directly contributing to dollarization persistence. Loan dollarization reached 72 percent, while deposit dollarization was 65 percent in 2011. Loan dollarization was largely driven by retail loans, which presented more than 30 percent of total loans in 2010. Consumer loans were mostly used for financing imports that further worsened the Georgian trade balance. Mortgages in foreign currency also encouraged price dollarization on the real estate market. The real estate and construction sectors emerged as the foremost winners of the post-revolutionary accumulation regime, in which the rate of price dollarization for buying or renting real estate remains very high.
The Georgian state government played a crucial role in constructing favorable legal conditions for foreign capital, empowering commercial banks, and cutting back key public functions. Mortgage loans and credit increased in order to compensate for this public sector withdrawal.
By embracing an inflation targeting monetary policy, Georgia’s central bank was also systematically weakened. Before the 2008-2009 crisis, the National Bank of Georgia (NBG) had to tackle the impacts of foreign capital inflow and currency appreciation through sterilization, but under inflation targeting its policy choices were constrained by price stability aims and exchange rate stability. Its major instrument—the interest rate—was ineffective not only due to dollarization, but also because of foreign bank ownership. Given that most banks in Georgia had access to foreign capital, they were not interested in lending from the central bank.
The changing nature of elite interests over the past decades helps explain the trajectory of Georgian economic policy. Prior to the revolution, dollarization benefited the shadow economy, which relied on foreign currency for bribes and black market transactions. It also benefited the financial sector, when banks promoted currency conversions and encouraged savings in foreign currencies. In the aftermath of the revolution, the Georgian government actively sought to weaken the NBG, even considering its abolition, in order to protect an accumulation regime constructed around foreign capital inflow.
Even after the government gave up its attempts to control the central bank, the NBG still served the interests of foreign investors. Its inflation targeting regime subordinated strong currency to price stability aims. Local financial elites, alongside foreign owners, profited from dollarization. Commercial banks had excess liquidity in foreign currency and were allowed to lend in foreign currency without restrictions. A highly dollarized real estate market also meant that foreign capital inflow and dollarization served the interests of economic elites from the construction and real estate sectors. Easy access to dollar loans with low interest rates appeared to be beneficial opportunities for the public, as long as the national currency was stable. In the meantime, civil society organizations—NGOs, academia, think tanks, and the media—neglected to approach economic policy as an arena of struggle, focusing instead on democracy and civil rights. Some of the nation’s leading universities as well as foreign think tanks supported the economic development policies of the post-revolution government.
The consequences
The currency crisis of 2015–2016 unraveled the structural socio-economic issues brought on by dollarization over the course of decades. By 2016, more than 50 percent of retail loans were denominated in foreign currency, and one-third of household borrowers spent more than half of their income on servicing their loans. Dollarization was thus politicized as a result of increased poverty and household over-indebtedness.
The currency crisis soon prompted a political legitimacy crisis. Public pressure, as well as the recommendations of the IMF and the World Bank, pushed the Georgian government and the NBG towards formal de-dollarization. The reforms restricted the volume of loans denominated in foreign currency, introduced payment to income and loan to value indicators for retail loans, encouraged real estate transactions in the national currency, and reintroduced a ceiling for the annual interest rate on all loans.
Despite these new regulations, the root causes of dollarization remain unresolved. Strong currencies cannot exist without strong state institutions, public trust towards the government, and a well-developed economy. De-dollarization measures cannot solely address monetary and fiscal policies or commercial banks alone; they instead must reflect more deeply on the role of the state in society, public participation in economic policymaking, and the impact of the international monetary system on the policymaking capacity of local governments. This requires substantial reform to the mandate of central banks and the architecture of the global financial system.
The much anticipated “return to normal” after the Covid-19 pandemic has been anything but. In contrast to the aftermath of previous economic crises, workers have not rushed back to work. Each month over a period of nine months in 2021, an average of four million people in the United States left their jobs. Similar trends were reported elsewhere. Resignation rates and job changes have been at a historical high in the UK; rates are rising in other wealthy countries like France, Australia, Netherlands, Spain, and even Singapore.
“The Great Resignation,” as the US trend was named in May 2021, attempts to summarize these shifts in employment. The term also carries major implications for fiscal and monetary policy. The trend looms large as the hidden text behind the Federal Reserve’s (and other central bankers’) responses to inflationary pressures, even though there is ample evidence that other factors—global supply chain issues, the war in Ukraine and subsequent sanctions on Russia, energy prices and food shortages, and also profit-seeking and price gouging—are responsible for rising inflation worldwide.
In what follows, we highlight the gendered dimensions of “The Great Resignation” in both the United States and China, which have been mostly neglected thus far. Although there is a growing literature which shows that women tend to be more (and differently) affected by economic crises than men, analyses of “The Great Resignation” have so far largely overlooked the gender dynamic. In this context, gender-blind policy responses have thus created a pretext for recovery which ignores the needs of women and minority workers.
The Covid-19 pandemic has led to a much higher rate of job losses in the United States than in Europe or Asia. The recession that followed was deeper than that of the global financial crisis (GFC) and its distributional effects were far more uneven—job losses and deaths were disproportionately concentrated in low-income groups, and among women, Hispanics and African-Americans. Women accounted for 70.8 percent of workplace illness caused by viruses in 2020. Their labor participation in April 2020 declined to 54.6 percent, the lowest since 1987 (it increased to 58.1 percent by December 2022, but remained below the 59.3 percent participation in February 2020).
US government programs including the CARES Act and American Rescue Plan reversed the course of the recession faster than in the GFC, allowing for quicker return to work. And yet, the workers did not come. In 2021, more than 47.8 million US workers quit their jobs. Analyses of unemployment rate and job openings indicated an increasingly “tight labor market” and its close correlation with the quit rate, as measured by the US Bureau of Labor Statistics (BLS).1The primary source of data on job quits in the US is the Bureau of Labor Statistics (<)a href='https://www.bls.gov/jlt/' target='_blank' rel='noreferrer noopener'(>)Jobs and Labor Turnover Survey (JOLTS)(<)/a(>). But BLS analysts also warned that the US quit rate in 2021—which stood at approximately 3 percent of the workforce—may not have been the highest historically. Similarly, two Harvard Business School professors convincingly argued that the quit rate in the United States had been creeping up ever since the GFC, leading The Economist to headline that “the evidence for The Great Resignation is thin on the ground.”
A “Great Resignation”?
We examined more than 150 articles covering “The Great Resignation” published in major US newspapers in 2021 and 2022. Most focused on professionals, explaining the crisis as the result of pandemic epiphany, changing life priorities, as well as government support and the (relatively) high rate of savings accumulated during lockdowns. Additional explanations emphasized the desire for higher pay, greater flexibility, and pursuit of better career opportunities. Although women frequently featured as “human interest” subjects in the media coverage of “The Great Resignation,” gender was rarely mentioned as a factor correlated with job quitting.
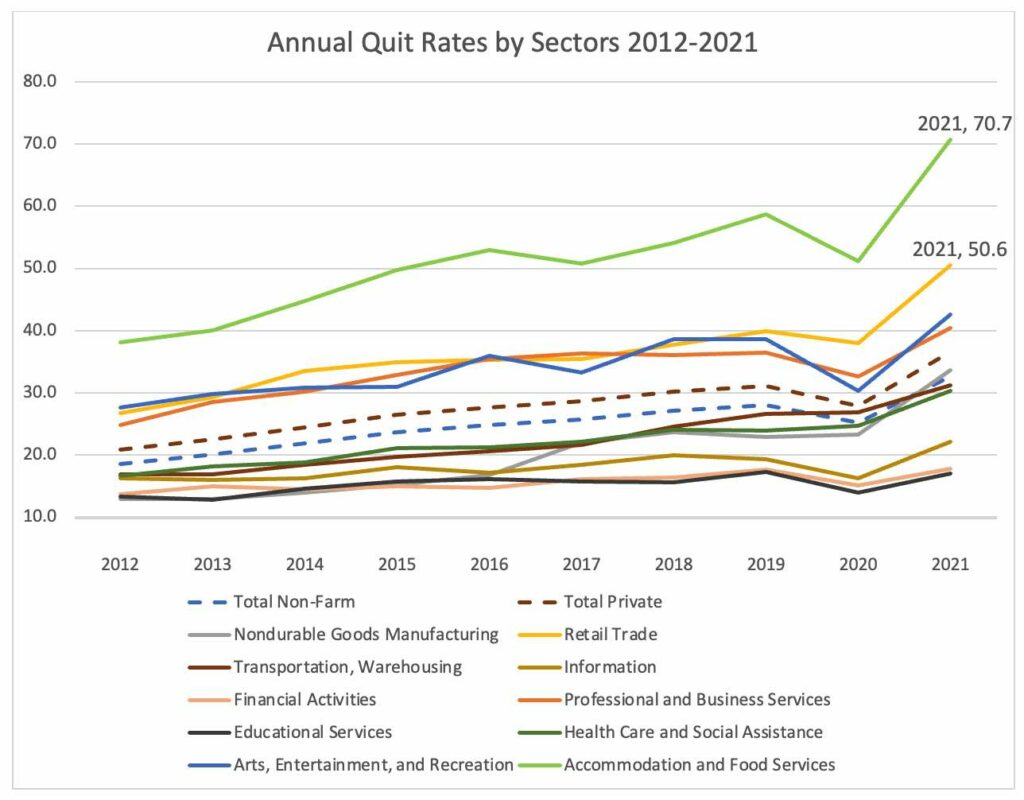
The media coverage was greatly influenced by widely-cited surveys conducted by private corporations, such as Microsoft’s Work Trend Index and “Global Workforce Hopes and Fears Survey,” administered by PricewaterhouseCoopers. While the surveys aimed to represent global employment trends, they over-represented professional and administrative workers in wealthy countries. A closer examination of available labor market data from BLS complicates these media and corporate narratives. Resignations have been most prevalent not in finance and information services, but rather in two sectors where employment rates are historically volatile: leisure and hospitality and retail trade. These were also the sectors where tele-commuting options were not available, and which—along with health care and transportation—carried significant risks of Covid-19 infection. They also have higher rates of female and immigrant labor. Accommodation and food services, where the rates of resignations were by far the highest in 2021 (70.7 percent), employs 52.5 percent women and 27.3 percent Hispanic workers. Monthly quit rates averaged 5.8 percent per month in 2022, up from 4.9 percent in 2019. The sector has traditionally depressed wages and low levels of unionization, and experienced massive layoffs at the start of the pandemic.
Figure 1 shows the data from 2012 until 2021 for the sectors with the highest quit rates. Frontline workers in accommodation and food services, retail, health care, and transportation were more likely to quit their jobs than others. As BLS economist Gittleman argues, “the recent quit rates are too high to be explained solely by labor market tightening.”
Figure 1 Source: Bureau of Labor Statistics, Jobs and Labor Turnover Survey, https://www.bls.gov/jlt/data.htm
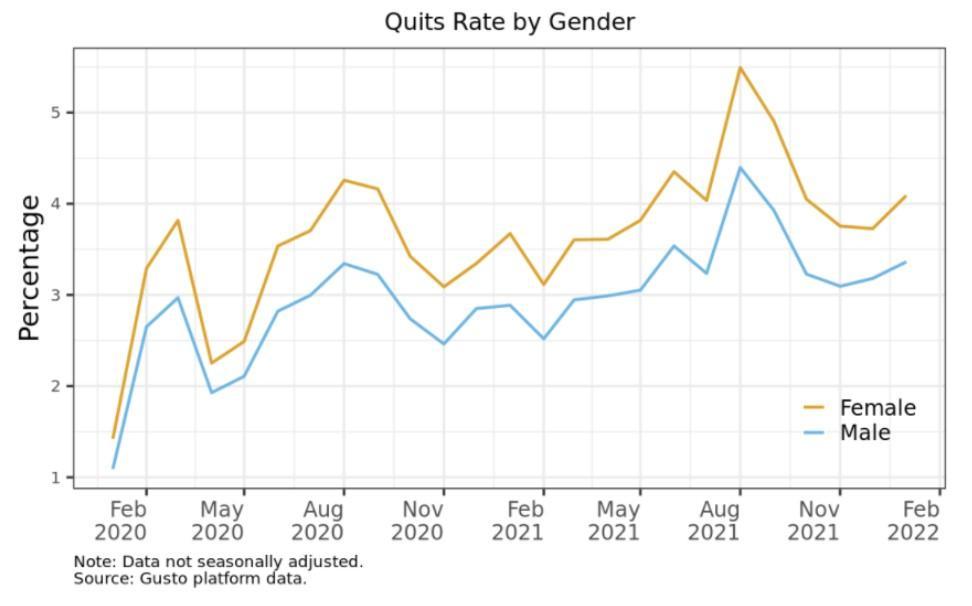
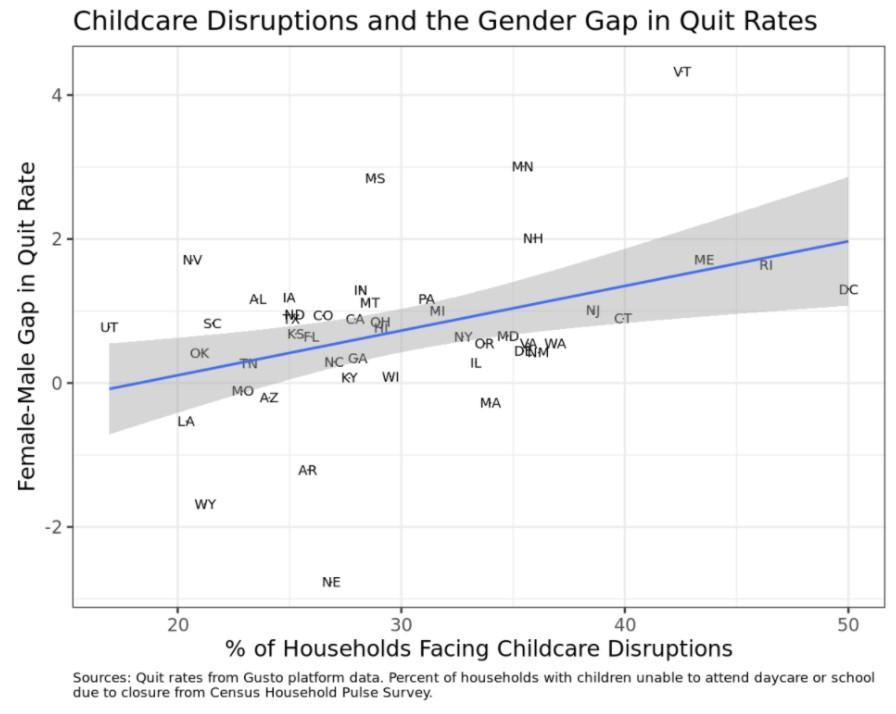
Other factors such as childcare and pandemic-related school closures, often invisible in mainstream economics, might have affected quit decisions. Analysis by Gusto found that the female quit rate was higher than the male rate (Figure 2), and women were more likely than men to quit their jobs due to school closures and childcare disruptions (Figure 3). States with the highest rates of disruption such as Maine and Rhode Island saw a gender gap of 1.7 percent.
BLS data also show that both men and women of working age who are not seeking jobs cite ill health and family responsibilities as their reasons for withdrawing from work. These same indicators had been declining in the years before the pandemic. And yet, the Biden Administration’s plans to include childcare and care for the elderly and disabled under the umbrella of infrastructure has failed in the US Congress. The US continues to lag behind the rest of the world when it comes to childcare provisions, ranking thirtieth (out of thirty-three) among OECD countries in public spending on families and children.
Figure 2 Figure 3
“Lying flat” (Tangping: 躺平) in China
In April 2021, a post on a social media platform Baidu titled “Lying Flat is Justice” went viral. The young Chinese urged their compatriots to opt out of a hypercompetitive work culture and resist social pressures to overwork. By “lying flat,” young workers did not quit jobs or exit the workforce, but instead they gave up promotion ambitions and greater economic returns. Rather than working full-time, some young workers chose flexible employment in the gig economy.
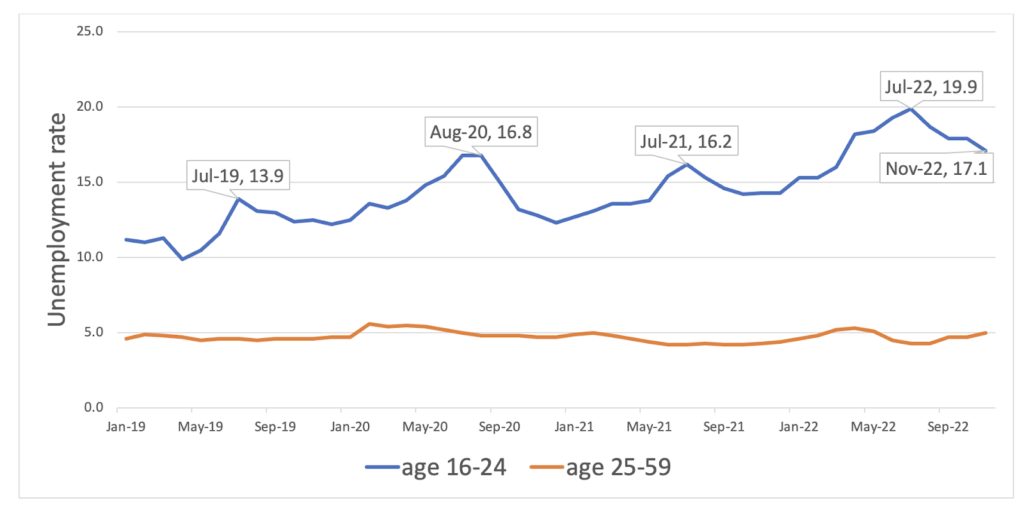
But “lying flat” was more than a personal choice. Severe unemployment among the young Chinese, in large part due to frequent lockdowns, was a contributing factor. According to the Unemployment Survey of the National Bureau of Statistics (Figure 4), the young Chinese (aged 16–24) unemployment rate was over 16 percent in July and August 2020 and July 2021. By July 2022, the rate had risen to 19.9 percent. The preference for “lying flat” clashed with President Xi Jinping’s ambitions to spur Chinese technological self-reliance and domestic consumption as the engines of economic growth. State news called “Tang ping” shameful, and “Tang ping” posts were deleted on social media. The protests in China, which erupted in December 2022—and led to the reversal of its long-standing zero-Covid policy—were in part fueled and galvanized by the discontent of the young Chinese.
Figure 4: Unemployment Rates from January 2019 to November 2022 in China Note: unemployment rates data are only available for the urban population. Source: (China) National Bureau of Statistics
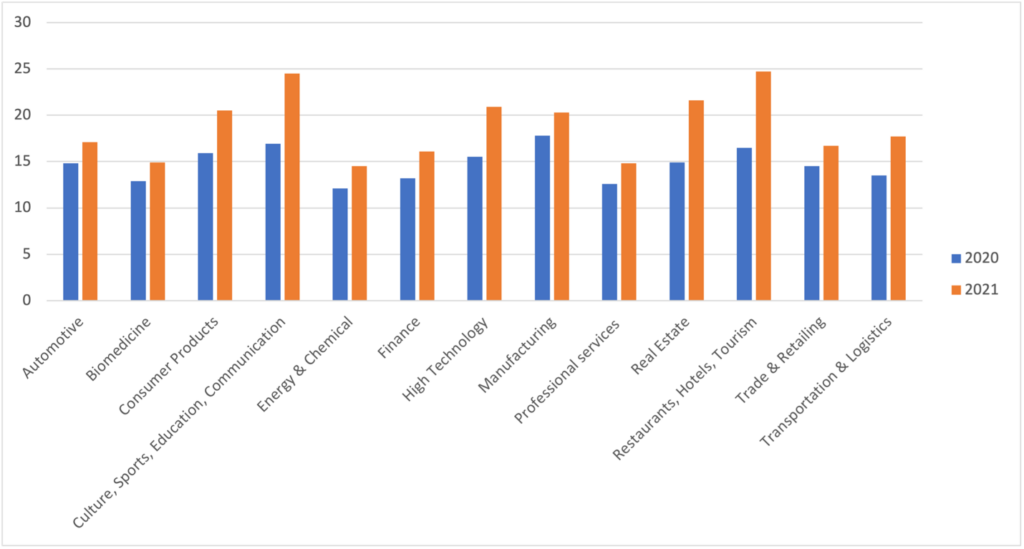
As elsewhere, the gender dynamics of China’s “lying flat” have been neglected. In China, female-concentrated sectors, such as restaurants, hotels, tourism and culture, sports, and communication have the highest turnover rates—close to 25 percent. In 2022, small businesses in restaurants, retail, and tourism remain at the “center” of the pandemic’s effects.
Figure 5: 2020 and 2021 Turnover Rates by Sector in China Note: turnover rate is the percentage of employees who have left a company over a certain period of time. It could be led by layoffs or quits. Source: 2021 Human Resources White Paper, 51 job, http://research.51job.com
China’s new education policy in 2021, which banned for-profit tutoring in core school subjects, might explain the high turnover rate in education. China’s “zero-Covid” policy (Qingling: 清零 ) and “standstill” orders (Jingmo: 静默) also played an important role in women’s labor force exits. Like in the US, the shutdown of childcare services has exacerbated China’s existing shortage of childcare provisions, worsening women’s childcare burden and disrupting their working status. (A recent Deloitte survey showed that 30 percent of Chinese women viewed themselves as “the only person in their households able/available to do household management and childcare.”) Burnout and depression have also affected their resignation rates. Zhang Dandan finds that 10 percent of Chinese female workers left the workforce at the end of 2020, whereas men’s leaving rate was 5.7 percent. Women’s return to work was also slower than men’s.
Finally, the “three-child” policy released in 2021 to reverse declining population trends is likely to worsen gender discrimination in the labor market, with employers potentially more reluctant to take on female jobseekers. Many companies are suspicious of their female workers’ childbearing plans and thus discharge them or keep them in low-level positions to avoid potential costs. The Chinese government has proposed tax reductions and subsidies, parental leave, inclusive childcare services, and other measures to support the “three-child” policy. But these are likely to fall short: some measures, like parental leave extension, will be difficult to implement in China’s highly competitive and discriminative workplaces. The subsidies (1,500– 2,800 USD in total) will barely alleviate childrearing costs—raising a child to the age of 18 is 6.9 times the GDP per capita in China. These supporting measures cannot reduce the discrimination in the workplace, and Chinese birth rates continue to decline (unlike in the United States, where the pandemic caused a mini baby boom).
Gender blind
Over the past year, “The Great Resignation” has been replaced by other buzzwords: “The Great Return” (labor participation began to inch towards pre-pandemic levels), “The Great Reshuffle” (workers changed existing jobs), and “The Quiet Quitting” (a decline in workplace engagement). Nonetheless, it remains important to understanding employment in the United States and around the world—pandemic burnout, “tight labor market,” alleged worker’s empowerment and demands for greater flexibility and higher wages, lackluster productivity, and even labor unrest.
Far from painting a picture of worker empowerment, the data shows that “The Great Resignation,” both in China and the US, has particularly affected women working in lower-salaried jobs. Much like the global financial crisis, media coverage of “The Great Resignation” has focused on professional classes and interpreted the phenomenon of job quitting as a matter of individual choice and advancement. But the portrayal of workers as suddenly in the driver’s seat of the economy has indirectly shaped conversations around the labor market and its implications for recovery and inflation.
Gender-blind interpretations of recent labor patterns have obscured how resignations have been concentrated in high-contact low-wage sectors, with predominantly female and often immigrant and/or minority labor force. Rather than a matter of choice or work-life balance, evidence suggests that women and minorities were pushed out of the labor market, having struggled under the pressures of job instability, health care risks, caregiving demands, and pandemic burnout. The combined effects of the pandemic, inflation, and the wide-ranging ripple effects of the war in Ukraine (energy and food crises) paint a grim picture for women in the labor markets and for women’s rights more broadly. These findings highlight the urgent need for policies informed by disaggregated data and attentive to gender and class dynamics in the labor markets.
This is the seventh edition of The Polycrisis newsletter, written by Kate Mackenzie and Tim Sahay. Subscribe here to get it in your inbox.
The Year of the Tiger is over. In the new year of the Rabbit, diplomats from around the globe—the US, China, Russia, and most recently IMF leadership—are descending on Africa.
Last week, China’s new Foreign Minister Qin Gang kicked off a series of visits from top statesmen with visits to Ethiopia, Egypt, Gabon, Angola, and Benin. After meeting with her Chinese counterpart Liu He in Switzerland to discuss debt and crisis management, US Treasury Secretary Janet Yellen went on to Senegal, Zambia, and South Africa. On Monday, Russian Foreign Minister Sergey Lavrov was in South Africa, with later stops to be made in Botswana and Angola. He plans to return in February to visit Tunisia, Mauritania, Algeria and Morocco. Meanwhile, IMF’s director Kristalina Georgieva is on her way from Zambia to Rwanda.
“Our engagement is not transactional, for show, or for the short-term,” Yellen told a group of women entrepreneurs in Dakar in a speech last Friday that set the tone for her ten-day trip. “The United States is here as a partner to help Africa realize its massive economic potential.”
Notwithstanding the diplomatic pleasantries, Yellen came to Africa in mask-off mode. Even as she courted deeper partnership, Treasury Secretary Yellen painted a stark picture of the paths facing the continent. Each of Africa’s huge assets—especially its youthful working population and potential for growth—is Janus-faced, she suggested. Without adequate resources for development, the working-age population is a tinderbox liable to devolve into unrest and conflict. “Demographics is not destiny,” she warned. “Africa’s demographic momentum can propel economic growth if, and only if, adequate investments are made.”
To make those investments, the US is positioning itself as the high-road alternative to Russia and China, which are scouring the continent for minerals and arms deals. The barely-concealed subtext of Yellen’s geo-economic speech concerned not just the level but the origin of those investments. “Countries need to be wary of shiny deals that may be opaque,” she said, which “can leave countries with a legacy of debt, diverted resources, and environmental destruction.”
Europe has also escalated its ambitions to secure gas and transition metals—goals that will involve tighter alliances with Africa. In a Monday speech in Germany, European Central Bank President Christine Lagarde warned that mineral demand from clean energy technologies could quadruple by 2040. “With the security of supply for critical inputs no longer guaranteed,” Lagarde said, “we are likely to see a new ‘scramble for resources.’”
The new US bullishness on African growth—always paired with sharp warnings about accepting investment from the wrong parts of the world—is in keeping with the gritted-teeth optimism of Biden’s December US-Africa Leaders summit.
At the meeting, African leaders sought support for Agenda 2063, the African Union’s long-term development agenda, and discussed the future of the African Growth and Opportunity Act, a trade program that provides some African countries duty-free access to the US in exchange for domestic reforms. The legislation expires in 2025. “From where I sit, the survival of AGOA will largely depend on changes to ensure more trade balance,” one African economist told Semafor.
American officials at the summit emphasized Africa’s potential for astronomical growth. Yet the US’s investment position is dramatically underweight Africa. Despite lawmakers seeing the continent as an essential player in the next century, and key to reviving sluggish aggregate demand, Biden plans to invest just $55 billion over the next three years. That is neck-and-neck with the commitments of other major countries, including much poorer ones. China has pledged $40 billion by 2025 and India expects investment to rise to $150 billion by 2030.
Meanwhile, China has been scaling down its overseas development finance, as Kevin Gallagher’s Global Development Policy Center has shown in a new report, “Small Is Beautiful,” on Beijing’s more selective approach to loans with smaller geographic and environmental footprints. But China’s 2008–2021 lending on the continent still rivals that of the World Bank. The question remains: why isn’t the US putting up the capital to back its official assessment of African potential?
Debt cancellation or “extend and pretend”
Even with substantial commitments of trade and aid, Africa enters the next decade of growth dragging a mountain of debt, estimated at $645 billion. On this front, Yellen has by most accounts been playing a genuinely constructive role. The gnarly task is to corral private sector and Chinese creditors into accepting debt haircuts.
China has been adamant that multilateral development banks, as well as private creditors like BlackRock, which is the largest owner of Zambian bonds, accept losses too. After a December trip to China, Georgieva returned, emphasizing a notion that she said is broadly shared by the Chinese public and officials: China will try to offer support, “but also, they expect to be paid back because [China] is a developing country.”
At G20 talks next month in India, creditors will attempt to move ahead on restructuring. There are some signs of a thaw in negotiations. But a debt restructuring is like a Mexican standoff: Everyone’s interests are opposed. China has raised potentially intractable objections. Bondholders want to minimize losses. Bilateral lenders want to put off the decision indefinitely. The IMF wants stability for the next 3-7 year program window. And debtor governments mostly just want to survive until the next election.
Africa’s ambitions depend on clearing away their debts. US and EU policymakers are now fixated on the climate crisis as a “threat multiplier” in emerging markets, emphasizing the havoc wreaked by drought and extreme weather. But physical threats are only part of the story. Africa will experience climate change as a debt crisis sooner and more pervasively than the continent will experience accelerating water stress and drought-related hazards. Interest payments are already eating into an unsustainable share of government revenue. Meanwhile, if the debt overhang isn’t addressed, none of the things that the rich world wants from Africa will materialize. Creditor-enforced austerity would throttle Africa’s growth and green hydrogen developmentalist dreams.
The risks of a new Cold War
“I spend a lot of time in countries all over Africa, and they’re like, ‘Eh, we wouldn’t mind a little more globalization, actually.’” So said Bono in a recent interview with the New York Times. Perhaps the celebrity singer-philanthropist was channeling the great Keynesian economist Joan Robinson, who quipped that “the only thing worse than being exploited by capitalism is not being exploited by capitalism.”
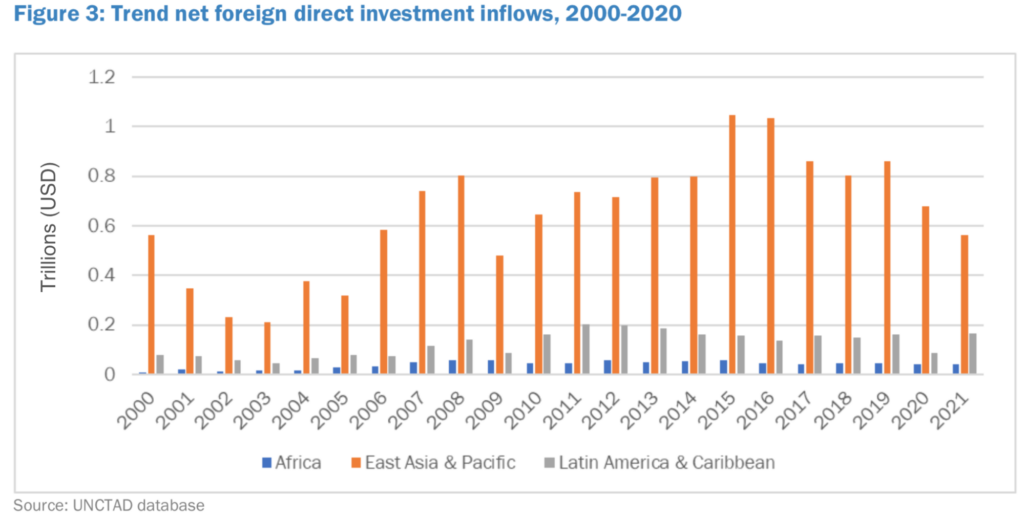
Over the course of the last few decades, a prominent story has been the takeoff of Asian growth against a backdrop of premature deindustrialization in Africa. Development depends on foreign direct investment and the technology transfer that can and should accompany it. FDI inflows to developing Asia totalled $476 billion in 2020, compared with just $38 billion for Africa. It is a travesty, as Hippolyte Fofack the director of African Export-Import bank points out, that Canada got more FDI in 2020 than fifty-four African countries put together.
The crucial question for development is not whether industrializing countries should plug into world trade, but how. The greatest risk to African development in the current climate is not North America and Europe scrambling for resources, but rather closing up their markets and cutting off FDI under the cover of new “onshoring” policies. The threat is real, since the US has hollowed out the political coalitions that once legitimized open trade.
At Davos, Georgieva cited IMF’s staff analysis to warn “geo-economic fragmentation” could cut GDP by 12 percent. How? By forcing countries to sever links, the new Cold War is going to hurt trade, migration, capital flows, and technology diffusion. That fear is perhaps why twenty-six African countries chose non-alignment.
When NATO held its two-day summit in Madrid in June 2022, the Spanish government deployed ten thousand police officers to cordon off entire parts of the city, including the Prado and the Reina Sofia museums, to the public. A day before the summit began, climate activists staged a “die-in” in front of Picasso’s Guernica at the Reina Sofia, in protest against what they identified as the militarization of climate politics. That same week, the US Supreme Court had removed federal protections for abortion rights, clamped down on the US Environmental Protection Agency’s ability to curb greenhouse gas emissions, and expanded the right to carry concealed weapons in the United States. In contrast to the chaos at home, at the summit, President Joe Biden’s team projected a revivified notion of hegemonic stability.
Primarily a transatlantic military alliance, NATO represents the concentration of global power in the North Atlantic.1Essentially G7 in representation although NATO, unlike the G7, has a secretariat and charter. In its self-described 360-degree approach to integrated deterrence—involving cyber-tech and “interoperability” between Allied defense systems—NATO is a twenty-first century Benthamite panopticon, under whose gaze lies the rest of the world. In the name of upholding democratic values and institutions, NATO has assigned itself the role of global crisis manager. Its extra territorial mandate now spans addressing “conflict-related sexual violence” to climate adaptation.
In NATO’s own hierarchy, the United States occupies the role of Supreme Commander. Its vision statement explicitly affirms America’s nuclear capability as the cornerstone of North Atlantic security. In response to Russia’s war on Ukraine, NATO took an aggressive stance, updating its policy manifesto to revoke the strategic partnership it had established with Russia in 2010. Its updated 2022 mission statement upholds the longstanding policy that if one NATO member is attacked, Article 5 may be invoked, allowing the alliance to engage in retaliatory attack.
A common myth propagated by economists is that in breaking down international trade and investment, wars interrupt globalization. Historians Adam Tooze and Ted Fertik have complicated this narrative. They argue that World War I activated the networks of nineteenth century globalization and violently realigned them. Similarly, the war in Ukraine has irrevocably altered the global landscape. The invasion was followed by the Group of 7 nations expelling Russia from the Western-controlled global financial system. Since then, the West has fought its counter-incursion on economic turf via embargoes on Russian trade, seizures of Russian foreign exchange reserves, and significant military support to Ukraine. Britain’s donation of a squadron of Challenger 2 tanks to Ukraine marks the first such delivery by NATO allies of powerful military hardware to be used on the battle-field. At the January 20 summit of top military brass (and representatives from some fifty countries) at NATO’s Allied Air Command base in Ramstein, Germany held off permitting its Leopard 2 tanks to be supplied. Later that day, protests broke out in Berlin with youth demanding “Free the Leopards.” (On January 25, they did so.) Both Vladimir Putin and Volodymyr Zelensky have framed the Ukraine war as one between Russia and NATO allies. The supply of heavy Western weaponry confirms that view.
The war in Eastern Europe has reassembled the entire global economic and energy system. As financial and trade networks were weaponized, so too were transnational energy infrastructures. Blaming Canadian sanctions, which blocked the return of a Canadian-maintained Siemens gas turbine to a Gazprom (the Russian state-owned gas giant) station, Russia drastically reduced the gas flowing through the Nord Stream I pipeline to Germany.2At the urging of the German economy minister Robert Habeck, the Canadian government issued a sanctions waiver allowing the repaired turbine to be delivered to Germany. Later, German chancellor Olaf Scholz would end up charging Gazprom with failing to meet its contractual obligations to take delivery of the repaired turbine. By December 2022, the pipeline was no longer operational, and the Canadian government rescinded its sanctions waiver. Soon after European governments accepted the US Treasury’s plan to cap the price of Russian crude oil, Putin suspended the supply of natural gas flows to Europe via the Nord Stream I. Before the war last year, Russia supplied forty percent of Europe’s gas and a quarter of all oil and gas traded globally; its commodity exports were exempt from Western sanctions. Cutting off Russia from the global economy in 2022 has created energy shortages globally and escalated prices, especially in Europe. The ratcheting up of global commodity prices, too, particularly for fuel and food, has prompted the biggest inflationary spike since the 1970s.
In response to the crisis, Europe is now relying on the US for energy imports; forty percent of its liquified natural gas now comes from the US, a stunning reversal from just last year when Europe shunned American LNG over concerns about the carbon emitted as part of its production and transportation. Much to the chagrin of climate activists, the EU parliament has voted to include natural gas, a fossil fuel, in its taxonomy of sustainable energy. Securing America’s most lucrative foreign market in Europe, the Biden administration has scored an unlikely coup for the hydrocarbon dollar.
One major decision that came out of the Madrid summit was the establishment of a permanent US military base in Poland, part of the largest US military expansion in Europe since the Cold War. Over a hundred thousand US troops are now stationed in Europe. Another outcome of the summit was the updating of NATO’s “military and political adaptation” strategy. In a naked power grab, NATO proposed that it “should become the leading international organization when it comes to understanding and adapting to the impact of climate change on security.” It intends to do this by “investing in the transition to clean energy sources and leveraging green technologies, while ensuring military effectiveness and a credible deterrence and defense posture.” In NATO’s new climate framework, the energy transition has effectively been co-opted into an imperial project.
War ecology meets militarized adaptation
NATO’s new framework of militarized adaptation recalls a version of what philosopher Pierre Charbonnier calls “war ecology.” Charbonnier’s concept speaks to the growing proximity of decarbonization and geopolitics, often in militarized form. He urges Europe to break its dependence on imported fossil fuels and reclaim energy and economic sovereignty via decarbonization. He also argues that political ecology should yoke decarbonization to a grand narrative that includes broader social transformation. Large-scale financial, technological, and administrative mobilizations required for a clean energy transformation have historically been associated with “total war.”
The war in Ukraine, which has accelerated Europe’s commitment to the energy transition, seems to confirm Charbonnier’s war ecology thesis. This geopolitical understanding mediates between the tragic view, which declares the impossibility of limiting carbon emissions to avoid the most catastrophic impact of climate change, and the naïveté of techno-optimists who believe that carbon sequestration technologies can be scaled up in time to limit planetary warming to 1.5 degree Celsius. Writing of the economic warfare and the suffering it entails for ordinary people across the globe, Charbonnier warns of the possibility of political ecology’s subordination to the military imperative. He cautions that war ecology may devolve into ecological nationalism and argues that climate advocates must disrupt the discourse of realpolitik and its complete cooptation by powerful interests while channeling the financial, logistical, and administrative capacities of “big states” and “big energy” towards green investment and infrastructure.
Perhaps most powerfully, Charbonnier’s concept of war ecology helps connect the dots between the transformative growth agenda of the energy transition and the single entity that is seemingly exempt from the inertia of American procedural legalism: its military-industrial complex. Given what American legal scholar Cass Sunstein calls “the dark cloud that now looms over the administrative state,” and the nonpartisan nature of the US defense spending, it is likely that climate finance will in future be folded into the US Department of Defense budget.
At first glance, NATO’s “militarized adaptation” appears to be an immaculate solution to otherwise delayed climate action. It can also be understood as an outcome of the normalization of emergency powers during the pandemic. In the US, the Defense Production Act and International Emergency Economic Powers Act have been activated several times over the last two and a half years to produce ventilators and vaccines, to import infant formula, and to seize foreign assets. Declarations of emergency might irk libertarians and academics but they generally pass under the radar of much of the American public.
In fact, climate activists pushed Biden to declare a climate emergency and to deploy emergency powers to enact a Green New Deal. Biden responded with a June 6 executive order, the Defense Production Act For Clean Energy, which bypasses electoral gridlock to expand green infrastructure such as wind farms on federal land. The order also states that it will mandate fair labor practices to build America’s clean energy arsenal. In terms of foreign relations, this new legislation simultaneously rolls back tariffs on Asian solar technology imports (critical to US solar manufacturing capacity) while avowing to “friend-shore” green supply chains between Allies.
Market turmoil
The war has been hugely profitable for oil and gas producers, whose incomes have more than doubled compared to their five-year average. With roughly a third of the world’s energy supply still coming from oil, a bit less than a third from coal, and about a quarter from natural gas, renewables comprise less than a tenth of global energy supply—there is plenty of profit to be made. Surging prices have pushed Saudi Aramco, the world’s biggest oil company, ahead of Apple as the world’s most profitable company. The US, however, is the world’s biggest oil and gas producer, contributing to a fifth of the global supply.
For various reasons—including the collapse in crude oil prices in 2020, as well the fear of stranded fossil fuel assets as the energy transition accelerates—oil and gas producers are increasingly reluctant to ramp up investment. This has translated into low inventories and high prices. While Saudi Arabia has the largest inventories globally, the biggest upstream investment increases in the industry are expected from US oil and gas firms. Investment in liquified natural gas has been the strongest across fossil-fuel asset classes. In the wake of sanctions against Russia, the US is poised to become the world’s leading LNG exporter. Windfall oil and gas profits in 2022 would be enough to fund a decade of investment in low-emission fuels that could meet the global net zero emissions target. As is clear from the blowback against Russian sanctions, states interfering in markets compromises efficiency. But governments not intervening in the event of market-externalities (emissions) can be costly on a planetary scale.
As fossil-fuel prices have soared, wind and solar alternatives have become cheaper. Investment in clean tech is now overwhelmingly driven by European oil and gas majors. The energy shock in Europe will continue to accelerate the trend towards renewables, but upstream disruptions in, for instance, the supply of rare-earth minerals (of which China is the world’s largest supplier) have slowed down green production chains. During US Treasury Secretary Janet Yellen’s trip to Senegal, Zambia, and South Africa—made on the heels of China’s foreign minister Qin Gang’s visit—there were discussions on electric vehicle battery manufacturing involving local critical minerals.
While the boom in oil prices benefits petroleum producers, rising prices at the pump are a significant driver of voter dissatisfaction in the US. Forecasts that Democrats would hemorrhage votes in the upcoming US midterm elections propelled an urgent bid by the Biden administration to tamp down gasoline prices. It conducted its first onshore oil-lease sales on public land, released a plan for offshore oil drilling, and supplicated a tarnished Saudi monarch to produce more oil, all U-turns from its former clean energy promises. The latter proved unsuccessful as the group of oil producing and exporting countries (OPEC plus, which includes Russia) announced dramatic cuts in oil production in the fall of 2022.
Progressives have jumped on the bandwagon. Recent proposals by left-leaning think tanks in the US include state-backed funding for new domestic drilling and nationalizing US oil refineries. The American stance is that building new fossil-fuel infrastructure is preferable to drawing down Russian sanctions in exchange for a political settlement and continued Russian energy exports to the West.
Core vs. periphery
Weaponizing financial and trade infrastructures has compounded both the energy and economic crises, which are now engulfing large parts of the world economy. The confluence of inflation, interest-rate hikes, and relentless dollar appreciation has led to debt distress (or high risk of debt distress) in sixty percent of all low-income economies. Russia, too, has defaulted on its debt, although not for a lack of finances. Rather, under the latest sanctions regime, the West refuses to process Russia’s external debt repayments.
Germany’s new rearmament commitments and the push for a new joint European armed force run parallel to the European Central Bank’s commitment to stabilize its sovereign bond markets. Member states have proposed reforms to the EU’s Stability and Growth Pact that will remove military and green spending from deficit and debt strictures. The drive for renewables in Europe is inextricably tied to energy independence from Russia. The energy shock has prompted the European Central Bank—unlike the Federal Reserve and the Bank of England—to commit to greening its asset purchases. With the euro hitting a twenty-year low against the dollar in the fall, the perceived threat to European sovereignty is not only coming from Russia, but also from American monetary and military encroachment.
Charbonnier’s view that Europe’s march towards energy independence should be framed as a grand historical narrative seems improbable. Having shut down its nuclear plants, acute energy shortages have led Germany, with its most green government yet, to expand a controversial coal-field—resulting in a violent crackdown on environmental activists protesting the decision in Lützerath. LNG is a much more segmented global market than oil, with starkly different prices in different world regions. Higher spot prices in Europe’s gas market prompted LNG suppliers to break contracts by invoking force majeure clauses and rerouting tankers originally headed for Asia to Europe. 70 percent of American LNG is now headed to Europe, resulting in acute supply shortages in the periphery of the world economy. Pakistan, already reeling from last year’s catastrophic floods, is now facing an energy and external debt crisis as well. Among the most climate-vulnerable nations in the world, Pakistan owes $100 billion in foreign loans. To stave off a balance of payments crisis, China recently loaned the country $2.3 billion.
In Pakistan, militarized adaptation means having the army deliver food and tents to millions of newly homeless people. For those of us under NATO’s nuclear umbrella—which, according to the organization, spans thirty nations and 1 billion people—militarized adaptation increasingly looks like fortification against a sea of climate migrants, especially from Africa to Europe. The American defense contractor Raytheon, lauded by the US Environmental Protection Agency for its climate leadership, has touted the demand for military products and services in the face of climate emergency. The same set of military assets may be deployed to control an influx of climate refugees.
The war in Ukraine has crystallized the emergence of two distinct energy, economic, and security blocs—one coalescing around the North Atlantic (NATO) and the other around the large developing economies or BRICS (Brazil, Russia, India, China, South Africa). In a weaponized world economic order, foreign policies are simultaneously operating along different geopolitical axes. India—a member of the Quad (Australia, India, Japan, US)—has been doing this somewhat successfully under the guise of neutrality. Japan is revising its constitution to eliminate its pacifist foreign-policy stance, and which will enable the US military’s presence in the Indo-Pacific. An intensified war ecology may also produce some positive outcomes; the G7’s Global Green Infrastructure and Investment plan is, after all, a geopolitical response to China’s Belt and Road Initiative.
Amidst the many uncertainties of a weaponized world economic order, what is clear is that the energy transition will involve significant macroeconomic instability and inequality, the likes of which we haven’t encountered before. It is also clear that much of the collateral damage will be borne by the periphery. Before the Ukraine war, it was estimated that the global South required $4.3 trillion to recover from the pandemic. The lending provided by leading multilateral lenders such as the IMF and the World Bank has been grossly insufficient. IMF lending is at a record high (extending across some forty economies) but the bulk of its trillion dollar coffer lies unused.
Another almost-a-trillion-dollars in IMF-issued international reserve assets known as Special Drawing Rights lie cloistered in mostly rich-country central banks or treasury departments. In the $650 billion pandemic-related SDR issuance in 2021, an entire two thirds of the total issuance went to upper income countries and only one percent went to low income countries. 117 billion SDRs (about $161 billion) are currently held by the US alone. As international reserve assets, SDRs serve many functions: as foreign exchange reserves, they can reduce sovereign financing costs and help stabilize currencies; re-channeled to multilateral development banks as equity, SDRs can leverage more lending; regularly issued as was originally intended under the 1944 Bretton Woods arrangement, SDRs can be an important source of financing the clean energy transition.
The most powerful multilateral lenders and core countries continue to eschew their responsibility to provide greater financial relief via a comprehensive debt restructuring mechanism or via rechanneling SDRs to multilateral development banks. Meanwhile, in the face of severe external financing difficulties, large developing economies like Egypt and Pakistan are expanding their reliance on bilateral creditors such as China and the Gulf states, somewhat ironically with the IMF’s encouragement. These attempted paths out of the crisis indicate the new “non-alignments” across low- and middle-income countries.
After a decade of low or negative interest rates, central banks are back in the business of fighting inflation. One of the clearest signs of the change in monetary policy stance is the largely synchronized tightening across high-income countries—last year, interest rates were increased by the central banks of Australia, Canada, the Euro Area, New Zealand, Norway, Sweden, Switzerland, the United Kingdom, and the United States, which together account for around half of global gross domestic product (GDP). As interest rates go up, however, so do the risks of economic contraction.
The trade-off between stabilizing inflation and stabilizing output (at least in the short-run) is ultimately what monetary policy is about: central banks must decide how much output losses and unemployment they are willing to tolerate in order to attain more stable inflation. So far, central banks have claimed that stabilizing inflation takes priority to avoid harsher monetary tightening and thus more economic pain down the road. Given the uncertainty in the inflation outlook, the most common advice from monetary academics and practitioners is for central banks to stay tight but ready to reverse course should the circumstances require, aka if a very severe recession takes hold.1For instance, IMF, World Economic Outlook, October 2022.
The assumption behind these claims and suggestions is that central banks can rather unproblematically switch from their role as inflation fighter to the one of recession fighter. In other words, the underlying idea is that, at different points in time, central banks are equally capable of fighting inflation as protecting employment and economic activity. Yet the experience of the past decade casts serious doubt on this assumption.2I argue and illustrate this in forthcoming work. Yes, central banks unmade monetary orthodoxy to stimulate economic activity and sustain employment in the aftermath of the 2008 global financial crisis. As the financial crisis unleashed severe deflationary and recessionary forces, central banks experimented with then largely unknown and unconventional policies, whose intended effects were to stimulate the economy once conventional interest rate policy had reached the zero-lower bound.3In addition to the intended effects, unconventional policies entail dangerous side effects too. Financial instability and the unequal distribution of wealth are certainly among them. See, for instance, Dietsch, et al., 2018. Despite this turnaround, central banks deviated from orthodoxy reluctantly and only under specific conditions: when they could protect their reputation as conservative and politically neutral inflation-fighter. That is to say, central banks’ support to economic activity was conditional on the preservation of the institutional image that monetary authorities have carefully crafted since the 1980s.
Central banks are incentivized to uphold their reputation in order to preserve their independence and political survival over time. Keeping up with reputation, however, can undermine the well-being of domestic economies. This is what happened as deflation supplanted inflation as the main economic problem: central banks often subordinated monetary accommodation to the preservation of their preexisting reputation, thereby making them reluctant to sustain economic activity. In a nutshell, central banks “cannot have it both ways”: they cannot equally fight both inflationary and recessionary forces if they are to preserve institutional expectations. Here is what the recent historical record tells us about central banks’ ability to deviate from their inflation-fighting mandate and what lessons this record suggests for current economic and political circumstances.
Monetary orthodoxy and reputation: 1980-2008
For over four decades, economic policymakers in high-income countries have been preoccupied with inflation. The inflation wave that started in the 1960s and deepened in the 1970s came alongside stagnating economic growth and soaring unemployment. The process of taming inflation was not straightforward and often marked by renewed inflationary virulence.
Fighting this inflationary wave was so formative for economic theory and policy that it is widely recognized as “the defining macroeconomic event of the second half of the twentieth century.”4Bryan, 2013. In particular, the success in controlling inflation that started in the 1980s, heralded by the US Fed under the leadership of Chairman Paul Volcker, marked the rise of a distinct monetary—and broadly macroeconomic—regime. Under the new regime, low inflation was elevated as the primary macroeconomic goal for domestic societies to pursue, and central banks were empowered to achieve that goal via the use of interest rate technology.
In order for central banks to be credible—to convince economic and financial actors of their resolve to keep inflation low and stable—two conditions were identified: legal independence, which led to the wave of legislated delegation of monetary policy to central banks around the world, and, importantly, a reputation based on conservativeness and political neutrality. Indeed, the Volcker Fed fight against inflation came to epitomize a distinct view of central banks’ mission, namely, the view according to which “central banks can and should use monetary policy to maintain low inflation over time.”5Goodfriend, 2005, 250, emphasis added. The notion of monetary neutrality was based on the observation that, in the long run, interest rate policy affects only nominal variables (i.e., price and inflation) and not real economic variables (i.e., employment and output). As a result, central banks could claim that their decisions do not have real distributional economic effects. One way in which central banks have signaled the distributional neutrality of their decisions has been the break-up of any form of explicit coordination with fiscal authorities. “The idea of financing fiscal deficits via money creation thus came to be seen as a mortal threat to central bank independence.”6Agur, et al., 2022. Monetary policy should simply not be enmeshed with governments’ policy and the attendant distributional consequences.
Reputation has proved a key political asset for contemporary central banks. Indeed, even if they are legally independent, central banks are still public institutions and, as such, they are dependent on government and public support to operate and survive over time. Their reputation has been instrumental in this endeavor. That is to say, sustaining and maintaining a reputation for being inflation-averse and politically neutral institutions had been the trademark of successful central banks since the 1980s and a crucial channel through which to build political and societal support for central bank policy.
Before the recent crisis period, central banks’ reputation was perfectly attuned to the economic and political conditions of the times. From the late 1980s until the early 2000s, low inflation and sustained economic activity justified what central banks had been doing, namely, placing relatively more weight on achieving the inflation objective as a way to tame, or even put an end to, the business cycle.
Then, the world changed. The crises of 2008 and 2020 took their toll on economic production and employment. Fighting recessionary and deflationary forces as to avoid the kind of 1930s Depression scenario thus became the first order of business.
In these changed circumstances, central banks moved away from the pursuit of low inflation—and interestingly so given the implications of recession and deflation fighting for central banks’ reputation. Indeed, fighting depressionary forces requires central banks to commit to actions that generate (not counter) inflationary pressures. With interest rates at the zero lower bound, fighting depressionary forces also entailed that central banks utilize openly distributive decisions, such as direct credit allocation to specific sectors and groups in order to sustain economic activity and employment. In practice, deflation fighting required central banks to act irresponsibly, that is, to act against the conservative and neutrality principles that had been the hallmark of their reputation.7Here, I borrow the notion of ‘irresponsibility’ from Krugman, 1998.
Yet, central banks did it—at least at first glance. Between 2008 and 2020, not only did major central banks bring interest rates to zero to boost moribund domestic economies. They also provided and sustained monetary accommodation by venturing into unconventional policies that up to that point had been considered a “theoretical curiosity” at best.8Woodford, 2012. With policies such as lending to banks (and even to nonbanks) in huge volume and large-scale asset purchases (so-called “quantitative easing”) central banks have strayed away from the orthodox terrain of interest rate policy and price stabilization to give pride of place to economic growth and employment considerations. Indeed, although the precise objective of unconventional policies varied among countries and over time, the key common thread of policies such as large-volume liquidity provision to financial institutions and the purchase of long-term government bonds and private securities has been that of lowering interest rates in order to support the supply of credit to the economy and maintain an accommodative monetary stance to sustain economic activity and employment.
Central banks’ unconventional policies have also tested the politically neutral pillar of central bank reputation. Indeed, by stepping into decisions regarding which firms to support and which assets to buy (including public debt), central banks have reduced the traditional arms-length distance of monetary policy from fiscal policy and blurred the principle of monetary dominance. In what sounds like an anathema to any casual central banking observer, postcrises central banks have even stretched the view that monetary policy can influence only the level of inflation by claiming overt responsibility for employment objectives and even issues such as inclusive growth and climate change. For instance, between 2020 and 2021, the US Fed and the European Central Bank (ECB) revised their monetary strategies in a way that signaled increased attention to employment considerations, as well as to social goals, including the pursuit of inclusive growth (in the United States) and climate change (in Europe).
According to a central banking veteran, “This [transformation] was something historically unprecedented and would simply have been unthinkable until then.”9Borio, 2020. This is not meant to gloss over the cross-country differences that do exist in terms of the specific design of unconventional policies. However, these differences simply “do not invalidate [the] general picture,”10Borio, 2020. namely, the picture of a profound transformation in the monetary regime firmly centered on the objective of price stability administered by conservative and politically neutral central banks.
Deviating from orthodoxy
Central banks were thus able to deviate from monetary orthodoxy and prioritize the support to economic activity. But appearances are deceptive. Analyzed closely, the transformations in central banking in the US and Europe11Moschella, forthcoming. reveal that the shift from inflation fighting to the promotion of economic activity was, at best, reluctant. Rather than putting their reputation as inflation-averse and politically neutral institutions on the line, both the US Fed and the ECB moved into unconventional terrain when the conditions to preempt or deflect reputational risks were in place. This reputation-protection behavior is evident in at least three ways.
First, unconventional policies were often expressly designed to circumscribe the scope of the policies adopted and so signal compatibility with central banks’ past reputation. In other words, central banks deviated from orthodoxy but with “caveats.” This is, for instance, clearly visible in the way in which the ECB designed its early liquidity operations to support markets and economic activity. Indeed, the ECB designed those policies by committing to the so-called “separation principle,” that is, divorcing policies oriented towards repairing the liquidity of financial markets from the policies aimed at influencing economic activity and inflation. By separating liquidity from formal monetary policy, “the message implicit in the ‘separation’ doctrine was that rates could always be raised to tame inflation,”as a group of ECB officials later acknowledged.12Rostagno, et al., 2019, 13 emphasis added. Similar design constraints can be found in the design of the ECB’s early asset purchase programs; both the Securities Market Programme (SMP) and Outright Monetary Transactions (OMT) were designed to absorb the liquidity injected by the central bank’s purchases (the so-called sterilization) to control potential inflation and allow the ECB to continue projecting an image as a conservative institution.
The Fed’s unconventional policies were also executed in line with past reputation. For instance, the bank’s early asset purchase programs relied mostly on the purchases of extremely safe Treasury securities, shaping general financial conditions without extending credit to particular sectors of the economy. The Fed’s repeated calls for policy “normalization” and “exit strategies” along with the implementation of its unconventional policies are further examples of the “caveats” that the central bank used to signal a return to monetary policy as usual and so protect its reputation.
In addition to policy caveats, central bank policies were strategically timed with government interventions. Some of the most unorthodox policies were adopted exactly when governments offered central banks political cover for monetary decisions that openly challenged the conservative and apolitical reputation that they had built since the 1980s. This political cover came in different forms on the two sides of the Atlantic. In the US, the Treasury offered open political and credit support for the Fed’s monetary decisions, including the Fed’s controversial liquidity support for financial firms (for instance, the Fed’s bridge loan to investment bank Bear Stearns) and the Fed’s interventions in asset-backed securities markets since 2008. In Europe, political support took the form of a sequenced division of responsibilities among the Eurozone governments and the ECB. Indeed, some of the ECB’s most unorthodox decisions, including the early asset purchase programs with their reputation-damaging distributive implications across national lines, were subordinated to the interventions of the Euro area governments. Specifically, Eurozone governments developed new policy instruments to lower pressures in sovereign debt markets (such as the European Stability Mechanism) and committed to fiscal austerity, which, in turn, created the conditions for the ECB to adopt policies that could more decidedly counteract recessionary and deflationary forces in the aftermath of the 2010 crisis.
Finally, central banks deviated from conventional tools in order to deflect criticisms of their reputation and win back political support. In particular, the increased salience and contestation of monetary policy among citizens in the US and Euro area prompted the banks to signal their willingness to meet the demands and expectations articulated by the public. Before the return of inflationary pressures in early 2022, both the Fed and the ECB tried to manage their public image by de-emphasizing their inflation-fighting credentials and committing to policy actions geared at attaining a “high-pressure economy,” i.e., one with stronger-than-average economic growth and low unemployment. Furthermore, the Fed and the ECB revised their monetary strategies in order to signal increased attention to employment considerations, as well as to attain social goals, including the pursuit of inclusive growth (in the United States) and climate change (in Europe).
From deflation to inflation to recession
The process through which the Fed and the ECB responded to the depressionary challenges unleashed by the 2008 and 2020 crises highlights a key lesson: central banks cannot unproblematically move back and forth between their roles as inflation- and deflation-fighters. In recent decades, they did mildly, with great difficulty, and under particular circumstances—government intervention key among them.
The reason lies not so much in the limits of an interest rate policy that hits the zero lower bound. The crucial hindrance to the symmetry of the price stability mandate has historical roots. Indeed, it was central banks’ past that led them to choose policies that could be made compatible with their preexisting reputation or to venture into controversial policies only when the conditions for protecting reputation were in place. In short, central banks’ capacity to combat recessions and stimulate economic growth is severely hindered by the reputational capital that central banks have carefully built in the past. This means that the trap central banks confront lies in their own identity: central banks have difficulties stimulating economic activity because they are primarily hardwired to fight inflation.
Recognizing the importance of reputation to central banks and the attendant difficulties that central banks confront in providing monetary accommodation and dispel depressionary forces cast serious doubt about central banks’ ability to stabilize domestic economies in a highly volatile scenario, like the present one. Despite the inflationary surge, the forces that contributed to the post-2008 deflationary pressures (among them globalized trade, automation, and demographics) persist. Added to these are new challenges, the most glaring of which is the transition toward a green economy.13Gabor, 2021.
In recent decades, we have grown used to thinking about central banks as the “masters of the economic universe,” that is, political actors who are able to steer domestic societies out of the woods of an economic and financial crisis. This flattering image largely stemmed from the success that central banks had reaped in fighting inflation since the 1980s. Fighting post-crises deflation and recession, however, has fully exposed the limitations that central banks are confronted with as political institutions. Independent central banks are poorly equipped to fight deflationary forces because the policies needed to counteract deflation call into question their institutional identity, which is staked on their reputation as conservative and technocratic bodies. Central banks are also poorly equipped to sustain reflationary policies over time because doing so invites social and political backlash with regard to their independence. As a result, we cannot wait for central banks to stimulate economic activity—doing so meaningfully would stretch their reputational limits.
Amidst the turbulence of the Second World War, hundreds of delegates from the Allied Nations met in Bretton Woods, New Hampshire to construct a post-war economic system. While it might strike one as odd that post-war choreography began in 1944, a year before the war ended, the truth is that states were planning peacetime from the moment the war began. The West feared replicating the blunders of the Treaty of Versailles and wanted to establish the next post-war order with prudence.1Frieden, Jeffry A. 2020. (<)em(>)Global Capitalism(<)/em(>). New York City: W. W. Norton & Company. One principal task for Bretton Woods attendees was to implement an international monetary system. Several proposals existed, including Keynes’ Bancor, which would have established an International Clearing Union to issue a supranational currency, oversee currency exchanges, and correct global imbalances. The war had weakened Europe, however, and strengthened the US. US negotiators exploited their influence. While the adoption of the dollar as the global reserve asset would give the US a significant upper hand, Europeans eventually relented because they could still convert dollars to gold and were assured that the arrangement was temporary.
Twenty-seven years later, a new crisis fractured the postwar economic peace enjoyed by the West. Rising inflation drove many countries, particularly European ones, to convert their US dollar reserves into gold. President Richard Nixon faced a choice between devaluing the dollar or pumping it up through perilous austerity measures. Global markets predicted that Nixon’s political savvy would drive him toward the former, but he shocked the world by taking a surprise third route, severing the dollar from the gold standard. There is a great deal of disagreement as to his decision’s long-term ramifications, but little debate about the global economic turmoil that immediately followed. Through it all, the dollar’s global hegemony endured, and it remains to this day.
With every global crisis since, the world has felt afresh the failure to create a truly international monetary system. After the global financial crisis of 2008, many discussed how dollar centrality and the overvaluation of the dollar contributes to the deindustrialization, trade deficits, and over-financialization of the US economy, even as the Federal Reserve continues to serve as the world’s central bank, giving it immense structural power.
Today, the correlated crises of the Russian invasion of Ukraine and mounting inflation further expose the dollar’s global dominance. Neither Russia nor any other country can free itself from the dollar. The Federal Reserve’s measures to tighten monetary policy and raise interest rates are strengthening the dollar at the expense of many other global currencies. Those who borrow in dollars—particularly countries like Sri Lanka, Lebanon, and Argentina—are feeling the global imbalance of monetary power most acutely.
The dollar may face its greatest challenge of the past century from the extraordinary polycrisis now unfolding, which is already reshaping the world economy.
The climate crisis
The climate crisis offers a new angle from which to evaluate US dollar hegemony, since carbon emissions are tied to economic activity.
Dollar hegemony constrains the rest of the world’s ability to finance the green transition because other countries have less control over their own monetary policy.2For more see further discussion in Pettifor’s(<)a href='https://www.versobooks.com/books/3102-the-case-for-the-green-new-deal' target='_blank' rel='noreferrer noopener'(>) The Case for the Green New Deal(<)/a(>). Also see recent scholarship by Althouse and Svartzman on(<)a href='https://doi.org/10.1080/09692290.2020.1854326' target='_blank' rel='noreferrer noopener'(>) global imbalances(<)/a(>) and(<)a href='https://doi.org/10.1093/cje/beac018' target='_blank' rel='noreferrer noopener'(>) finance-dominated capitalism(<)/a(>). My work is complementary but focused primarily on the US dollar. My research3For the working paper, please email (<)a href='mailto:daniel_driscoll@brown.edu' target='_blank' rel='noreferrer noopener'(>)daniel_driscoll@brown.edu(<)/a(>). suggests that dollar hegemony is an external constraint on US decarbonization, as well. This is because dollar hegemony:
1. drives up the carbon-intensity of the US growth model;
2. obscures the responsibility for emissions in trade; and
3. undermines American green manufacturing in the global arena.
America’s growth model is driven more by household consumption than exports.4Baccaro, Lucio, Mark Blyth, and Jonas Pontusson, eds. 2022. (<)em(>)Diminishing Returns: The New Politics of Growth and Stagnation(<)/em(>). Oxford, New York: Oxford University Press. The dollar’s role as the world’s reserve currency helps increase household consumption domestically. How does that work? The high demand for the dollar, and its resulting overvaluation,5Note that a significant portion of US dollar-denominated asset creation takes place (<)a href='https://doi.org/10.1017/S153759272200127X' target='_blank' rel='noreferrer noopener'(>)offshore(<)/a(>) in private hands. This may further increase global dependence and demand for US dollar-denominated assets. It also may contribute to the currency’s overvaluation. raises the relative price of American goods in global markets, costing US exports in market share and competitiveness. As a result, the US has become the largest global importer and source of demand.6Klein, Matthew C., and Michael Pettis. 2020. (<)em(>)Trade Wars Are Class Wars: How Rising Inequality Distorts the Global Economy and Threatens International Peace(<)/em(>). Illustrated Edition. New Haven: Yale University Press. In effect, the world transfers its consumption to the US.
Most crucially, household consumption in the US is comparatively carbon-intensive. On average, American households consume more electricity, drive more, and enjoy cheaper fuel per capita than comparable wealthy democracies. Much of that energy consumption comes from fossil fuels. Plotting US trade data against carbon emissions confirms the wider world’s role in American consumption—more imports, more emissions.
Germany, the paragon exporter, complements this dynamic perfectly. The German growth model suppresses wages and household consumption to maintain export competitiveness.7Baccaro, Lucio, and Chiara Benassi. 2017. “Throwing out the Ballast: Growth Models and the Liberalization of German Industrial Relations.” (<)em(>)Socio-Economic Review(<)/em(>) 15(1):85–115. Thus, when plotting the German current account balance against its emissions, one sees emissions decrease with trade surpluses.
US (left) vs German (right) current account balances and emissions compared
Data: World Resource Institute, World Bank, FRED
To make this comparison even more concrete, let us examine the relationship between the two countries within a single sector: German-manufactured cars, exported to its most valuable trading partner, the US. Suppressing consumption means that German domestic emissions are lower, and that Germany enjoys a trade surplus. This allows Germany to hold US reserve assets as surplus, which, in turn, drives up American deficits, consumption, and emissions. Americans then drive the imported German cars with vigor, spewing carbon into the atmosphere and increasing domestic emissions. Thus, Germany has lower emissions in part because the US imports them.
In green manufacturing, too, dollar centrality undermines the United States’ capacity to remain competitive. The overvaluation of the dollar (remember, due to high demand for it as a reserve asset) has led to the general decline in manufacturing and the overvaluation of US goods on global markets. Comparatively weak resource endowments in the critical minerals needed for green technology8Riofrancos, Thea. 2022. “The Security–Sustainability Nexus: Lithium Onshoring in the Global North.” (<)em(>)Global Environmental Politics(<)/em(>) 1–22.coupled with overpriced green manufactures do not bode well for the United States in its effort to lead the green transition.
We are already witnessing this dynamic at play—US solar panel manufacturers are unable to compete with Chinese ones. China produces the majority of solar panels in the world and President Biden recently suspended added tariffs and duties on Chinese solar-panel imports to accelerate decarbonization. Naturally, American solar producers are unhappy with the decision because they cannot hope to compete with Chinese prices. Yet given China’s semi-monopoly over the critical minerals needed for green tech and their competitive pricing, rapid decarbonization sometimes requires open trade partnerships.
Reform?
There are two approaches to tackling the dollar hegemony carbon problem. The first is structural and long-term, and the second is targeted and short-term. The obvious structural solution resembles Keynes’ Bancor—a new supranational currency that restores global currency balances and equity. Such a currency would clarify the interdependence between growth models and emissions in trade. It would also empower peripheral countries with more monetary autonomy to decarbonize.
Global coordination seems unlikely in this historical moment, however, and the climate crisis requires immediate action. Targeted measures can correct some global monetary disequilibria and complement green industrial policies and decarbonization. For instance, bilateral discussions between the US and its key trading partners on embedded emissions could achieve results in a short period of time. Countries that export to the US benefit from export growth but are not held accountable for the emissions that result from American consumption. Countries with trade surpluses in US assets such as Germany and China could invest that surplus in national green infrastructure projects, a crucial step, because without decarbonizing household consumption, domestic investment will increase domestic consumption-based emissions.9What is the point of rebalancing if it only shifts emissions to another country? Investment would also relieve some external pressure on US consumption and, by proxy, decrease emissions driven by excess demand for US assets.
American demand and household consumption, then, will experience some relief. The value of the dollar will be less inflated and other countries investing in infrastructure will demand US goods. Being priced more competitively bodes well for the success of American green manufactures.
Bilateral discussions between powerful and rich countries do little for the peripheral countries that will bear the worst effects of climate change. They are also disadvantaged by the inequity and hierarchy in the international monetary system. Due to dollar hegemony, banks in these emerging-market economies rely on US dollars to pay loans, debts, and interest. As the Fed raises rates to curb inflation, a stronger dollar means the value of their dollar-denominated liabilities is increasing as the value of their national currencies decrease, along with their capital flows and banking leverage. A stronger dollar also means weakened manufacturing and trade in many of these countries. Global investors have become risk averse and are diverting capital from emerging economies to US dollar-denominated safe haven assets. At the very worst, countries at the periphery risk a banking recession coupled with severe liquidity constraints, all due to a strong dollar. Thus, remedying monetary disequilibria and inequality is crucial.
One obvious step in this direction in the short-term would be to expand climate-specific trusts and special drawing rights issued by the International Monetary Fund to support adaptation and decarbonization in emerging market economies, especially those most climate-vulnerable. At this point, special drawing rights are allocated to countries based on quotas and voting power; in practice, this means the wealthiest countries in the world receive the lion’s share of the funds. The brilliant leadership of Mia Mottley, Prime Minister of Barbados, should serve as a model to other lower- and middle-income countries that are in debt distress and whose future is thrown into doubt by climate change. Mottley negotiated the restructuring of her island’s debt and asked that billions from special drawing rights be redistributed to the countries that need them most. The funds would be used to invest in climate resilience and develop the green infrastructure crucial to their future survival.
These measures can correct some of the structural hierarchy and disequilibria in the international monetary system. Like green industrial policy, monetary balance is essential for global decarbonization. The policymakers at Bretton Woods were prudent enough to plan the future before the war ended. Contemporary policymakers can better plan the green transition amidst our crises today.
This is the sixth edition of The Polycrisis newsletter, written by Kate Mackenzie and Tim Sahay. Subscribe here to get it in your inbox.
There has been little research into the inflationary implications of either climate change itself, or of responses to climate change. The majority of work on central banking and climate change is concerned with topics like firm-level or macroprudential regulation, collateral requirements, and asset-purchasing programs. Questions relating to carbon pricing and the cost versus benefits of cutting emissions are disproportionately important for climate economists.
Such a narrow focus reflects the policy preoccupations of the eras in which they emerged. Until last year, permanently low inflation was plausible, at least in the Global North. There was little concern for how a destabilizing climate or resurgent petrostate aggression might jolt logistics until the reopening after Covid lockdowns and Russia’s invasion of Ukraine wreaked havoc on markets.
Supply squeezes and higher costs in everything from medical equipment to chips to crude oil painfully illustrated the cost of allowing markets to determine prices, with little intervention even for the most critical categories.
Isabella Weber’s 2021 book How China Escaped Shock Therapy was a timely exploration of sector-specific measures, chronicling how Beijing applied market reforms selectively, retaining control over the prices of systemically important goods such as food and energy.
In the last few months of 2022, Weber served on Germany’s gas price commission, whose recommendations informed a central part of the German €200 billion response to the energy-price crisis. A new paper she co-authored with Jesus Lara Jauregui, Lucas Teixeira, and Luiza Nassif Pires identifies which prices are most important to inflation.
The paper builds on work by Robert Hockett and Saule Omarova about the criticality of certain prices and sectors. Importantly, for us, it also sheds new light on the themes in a brief by Lauren Melodia and Kristina Karlsson of the Roosevelt Institute, which identified the inflationary implications of the inherent volatility in fossil fuel-based energy systems. The upshot of the Roosevelt brief is clear: governments that build out clean energy infrastructure are permanently reducing inflationary pressures.
In looking broadly at the drivers of inflation, the paper by Weber and her co-authors has particular salience for the energy transition. Having identified the sectors, goods, and services that are most relevant to inflation, they isolate three characteristics of prices that are systemically-important: criticality of the sector in relation to all other sectors; price volatility; and share in personal consumption. This pertains not only to prices that one expects are important, like that of food and energy, (“petroleum and coal products” was by far the most significant) but also to prices that appear removed from day-to-day economic activity like upstream oil and gas exploration or wholesale trade.
A key emphasis of Weber’s is that the transition to a stable energy system will require intensive and careful work from policymakers. Contrary to the notion that there will be a simultaneous implosion of fossil fuels and a green boom, Weber stresses that new energy infrastructure will need to be created before the old fossil-fuel sources can be switched off.
The “mid-transition”
We are in a period of moving away from a fossil fuel-based economy and towards a clean one—the “mid-transition” as Emily Grubert calls it, or “getting to the other side” as David Wallace-Wells says.
A paper published in October by Aljoša Slameršak, Giorgos Kallis, and Daniel W. O’Neill explores a facet of this awkward process by modeling the energy and emissions requirements to transition the energy system. It finds that this could require a fifth of the net “budget” of carbon dioxide that can be released before the 1.5C threshold is exceeded. That means that, depending on the nature of the transition, the energy available for sectors such as aviation, steel, and cement—which are more difficult to decarbonize—might be even more limited than thought.
The findings don’t support claims, however, that the production of solar panels, wind turbines, and electric cars are too resource-intensive to make them worth pursuing. Rather, the papers draw on ample evidence showing that the relative “energy return on energy invested (EROI)” of renewables is improving much faster than expected. At the same time, the EROI of fossil fuels is known to be gradually declining. The energy transition itself slightly increases energy use insofar as new technologies need to be produced, but the overall reduction in emissions makes it worthwhile. This is truer of a faster transition that relies more on renewables and nuclear, rather than a slower transition more dependent on fossil fuels and bioenergy plus carbon capture.
There are numerous pitfalls in the modeling of energy transition, which attempt to reconcile shifts in technology, costs, and energy demand with other factors, including population and economic growth. Even defining the boundaries of energy systems is complex. Does one count the energy transporting fuel? Does a full lifecycle analysis account for how energy is changing? And should the benchmark be final energy demand, consumption, or production? These decisions have huge effects on which energy pathways look most appealing.
No one expects the smooth lines of the energy transition pathways to be borne out in reality. In an interview with Kate last December, Isabella Weber spoke of how old and new energy systems will need to coexist for some time. This means that “there will be bumps, but maybe less bumps than if you were to try to mimic the straight transition path.” The full interview can be found here.
In the early 2000s, Finland was the darling of industrial and employment policy analysts everywhere. This small country with a population of 5.5 million and a GDP roughly equal to the state of Oregon experienced what looked like a high tech-led productivity revolution. Real GDP per capita in local currency terms rose 55 percent from 1995 to 2007—nearly double the US increase and close to the pinnacle of the twenty-one richest OECD industrialized economies.
Yet spectacular growth abruptly halted after 2008. GDP continued to rise with population growth, but from 2008 to 2019 real Finnish per capita income declined. The European Central Bank’s dilatory response to the eurozone crisis, and the austerity policies that followed, undoubtedly explain part of this abysmal performance. But an equally large part is due to Finland having many of its growth eggs in a single basket: Nokia. Nokia’s handsets and related telephony equipment accounted for 20 percent of Finnish exports at peak, driving Finland’s current account surplus to nearly 7 percent of GDP.1All data on exports are from the (<)a href='https://intracen.org/' target='_blank' rel='noreferrer noopener'(>)UN International Trade Center(<)/a(>). Data on R&D are from the European Commission (<)a href='https://iri.jrc.ec.europa.eu/data' target='_blank' rel='noreferrer noopener'(>)database(<)/a(>) on the 2500 largest R&D spenders in any given year from 2004 through 2019. This cumulates to 5303 firms over 56 countries and territorial units. When the Apple iPhone launched in 2007, Nokia’s handset market collapsed, exports fell by half, Finland’s current account swung into deficit, and a decade plus of economic stagnation began.
Finland is not the only economy facing “Nokia risk.” A larger group of seven countries—all of them relatively small, rich, and with stable governments—are similarly exposed. In Denmark, Israel, South Korea, Sweden, Switzerland, and Taiwan a handful of firms account for a hugely disproportionate share of both profits and R&D spending. The firms which dominate these seven economies have all been extraordinarily successful in the knowledge economy of the past three decades: Samsung Electronics in Korea, Taiwan Semiconductor Manufacturing Co. in Taiwan, Novo Nordisk (pharmaceuticals) in Denmark, and Roche and Novartis (pharmaceuticals) in Switzerland. For the decade of 2011–2020, these firms have had large shares of cumulative profits both domestically and abroad. It is largely thanks to these profits that these small countries have such a significant share of global profit (larger than their share of global GDP) and, in turn, a relatively high per capita income.
Table 1 shows the ratio of the share of cumulative global profit and of R&D expenditures to country share of global GDP, with some comparisons to the larger rich OECD countries. The figures are based on 21,580 global ultimate owners (headquarters firms) with annual sales averaging at least $10 million between 2011 and 2020, and which have enough comprehensive financial data to make comparison possible. While this calculation excludes a big chunk of small and medium sized industries (or SMEs, firms with fewer than 250 employees), these 21,580 are the biggest among the 41 million in the Bureau van Dijk Orbis database. The handful of firms discussed here is thus both mathematically and macroeconomically significant, as the very long tail of SMEs typically depends on those larger firms for their revenue. For example, Danish pharmaceutical giant Novo Nordisk alone accounts for a quarter of cumulative profits for the 200 plus Danish firms in Table 1; its 0.2 percent share of cumulative profits for all 21,580 firms is almost 50 times the average for that group.
Table 1: Ratio of share of cumulative Profit and R&D spending to share of Global GDP, by country, 2011–2020
Profit
R&D
# of firms
Taiwan
2.83
4.07
591
Sweden
2.18
2.24
360
Switzerland
2.00
4.89
131
Denmark
1.94
1.05
222
Korea
1.63
2.10
706
Finland
1.15
3.05
185
Israel
0.53
1.07
101
For comparison:
Norway
1.80
0.24
253
Japan
1.58
3.07
2694
USA
1.45
1.75
2524
Germany
0.97
1.70
1274
Source: Author calculation from Bureau van Dijk Orbis database and IMF World Economic Outlook database
In the coming years, these firms and the national economies that house them will confront two big challenges. On the economic front, the fifth Schumpeterian growth wave, which was built on information and communication technologies (ICT) as well as traditional and first-generation bio-engineered pharmaceuticals, has exhausted much of its growth impulse. A potential sixth wave built on artificial intelligence (AI), machine learning (ML), and second-generation biotech (CRISPR) as general-purpose technologies threatens these firms’ existing production systems and markets. At the same time, governments everywhere are ramping up antitrust and other attacks on visible monopolies, and edging towards more nationalistic industrial and trade policy. In light of the central role of these firms that account for disproportionate shares of their home economy exports, failure to navigate these challenges will result in a major economic shock for their small, rich countries.
Schumpetarian waves and industrial transitions
Joseph Schumpeter’s analysis of dynamic change in capitalist economies—what he termed “creative destruction”— sheds light on the economic risks facing the core firms in these seven economies. Schumpeter argued that the central puzzle in economics was explaining the sources of dynamic growth. In an economy that actually embodied the starting assumptions of mainstream economics—small, competitive firms with no barriers to entry and no pricing power—profits would fall to the cost of capital plus some managerial wage for owner-operators. In essence, profits would only cover depreciation. Consequently, extensive and intensive growth would slow to the rate of population growth plus some gains from the normal productivity creep that incremental innovation produced for firms—in short, the kind of economic slump that prompted the secular stagnation debate of the 2010s. This circular economy, as Schumpeter called it, would never produce the periodic eruptions of rapid technological change and growth that he observed in the two centuries after the industrial revolution. As he put it, in these circumstances, you could add as many stagecoaches as you wanted to the economy but never get to a railroad.
Dynamic growth required radical innovation in five key, interconnected areas: new modes of transportation, new energy sources, new consumer goods, new general purpose production technologies, and, though he underemphasized this, new legal organization or governance structures for firms. Writing on the eve of the Second World War, Schumpeter identified four such revolutions that had so far taken place. The first initiated the industrial revolution, centering on canals, water mills, textiles, and other household nondurables, with small owner-operated factories collecting handicraft producers under one roof. The second, in the mid-1800s, focused on steam power, railroads, and iron goods, as well as larger but still owner-operated factories using custom made machinery. The third, towards the end of the 1800s, emerged from electricity, steel steamships, urban trams, bicycles and chemicals, and saw the rise of large corporations which began to separate ownership and management. The fourth wave centered on internal combustion engines for land and air transport, petroleum, mass consumption of consumer durables like vehicles, continuous flow-assembly line production, and vertically integrated and often multidivisional firms with full separation of ownership and management. This wave began in the United States, most famously with Ford’s Model T, and spread to Europe and Japan. The transition periods between each of these growth spurts all saw increased domestic or international conflict and decreased investment in ageing growth sectors. Thus the transition from wave three to wave four saw the beginning of industrial unions and coincided with rising interimperial conflict that eventually produced World War I.
The fifth wave began in the US in the 1960s with the development of the semiconductor chip, and soon spread globally. It is based on connectivity via electronics (ICT), negative energy consumption via digitalization, pharmaceuticals and first-generation biotechnologies, software and semiconductors, global supply chains, and de jure vertically disintegrated firms with de facto control by lead firms. This era’s iconic product, the smartphone, embodies the whole range of electronics products developed from the 1940s onward in a compact and relatively cheap form.
There are many reasons to think this fifth wave is nearing exhaustion. Smartphone sales levelled off in 2018 and then declined somewhat, signalling replacement sales rather than growth. Despite the annual iPhone launch hype, most of the improvements to smartphones in recent years are largely marginal. Roughly 80 percent of the world’s population has 4G access—if they can pay for it. The entire global electronics industry is linked to personal computers and smartphones, which account for roughly half of global chip sales. Similarly, new pharmaceutical discovery levelled off in the 2000s, with most new drugs being copies or modifications of older drugs.2That said—as we will note below—a rising share of drug approvals concern bio-similars rather than the traditional small molecule pharmaceuticals.
But sales volumes simply reflect more important trends. Several key technologies and industries have already emerged in the energy and transportation space as well as, albeit with less clarity, in production software and pharmaceuticals.3The US state is already organizing policy around this. See (<)a href='https://www.whitehouse.gov/briefing-room/speeches-remarks/2022/09/16/remarks-by-national-security-advisor-jake-sullivan-at-the-special-competitive-studies-project-global-emerging-technologies-summit/' target='_blank' rel='noreferrer noopener'(>)remarks(<)/a(>) by National Security Advisor Jake Sullivan in September 2022. Alternative and renewable energy sources are clearly replacing fossil fuels as the basis for electricity generation and equipment power, including the critical transportation sector. And AI and ML appear to be general purpose production technologies reshaping both biotechnology (along with the new CRISPR-Cas gene editing technology) and the organization of machinery production. Table 2 summarizes the economic and political risks this sixth wave poses for core firms in these seven economies.
Table 2: Economic and political risks
Country
Firm
Sector
Political Risk
Economic Risk
Denmark
Novo Nordisk
Pharmaceuticals
Regulation of Insulin prices
AI based genomics shifts value to personalized drugs
H. Lundbeck
Pharmaceuticals
Regulation of Insulin prices
AI based genomics
Vestas
Energy – windmills
National champions in other countries
Growth potential is high
Finland
Nokia
Telecom equipment
5G becomes a national security issue
AI & ML shift value to software
Israel
Teva
Pharmaceuticals
Price regulation in general
AI based genomics
Korea
Samsung
Memory chips; phones
Policy driven on-shoring by US and EU
AI design shifts more value to systems on a chip
Hyundai
Vehicles
Electrification
AI shifts value to battery management software & driver aids
Sweden
Ericsson
Telecom equipment
5G becomes a national security issue
Software-based switching systems replace hardware-based systems
Volvo (Trucks)
Vehicles
Electrification
AI shifts value to battery management software & driver aids
ABB, Assa Abloy, Sandvik
Machinery Firms
Deglobalization, EV effects on German car industry
AI & ML shift value to software; EV requires fewer parts
Switzerland
Novartis
Pharmaceuticals
Price regulation in general
AI based genomics
Roche
Pharmaceuticals
Price regulation in general
AI based genomics
Taiwan
TSMC
Semiconductor fabrication
Policy driven on-shoring by US and EU; war
Subsidized national champions
Hon Hai Precision
Electronics assembly
US-China tensions
AI design shifts more value to systems on a chip, simplifying assembly
Source: Author assessment
Calculating risk
Creating the huge reticulation networks that made new energy and transport sources useful required equally huge investments. One mile of railroad was pointless, 100 miles was revolutionary. Schumpeter, in his earlier works, argued that only entrepreneurs hyping potential monopoly profits could induce bankers to finance these huge investments. He called this the Mark I model, in which small start-up firms run by visionaries upend existing incumbents. Many of the current software giants fit this pattern, but it also characterized the earliest days of Ford. Later, Schumpeter noted that high-profit corporations could channel their monopoly profits to dedicated internal research labs and generate the same kind of revolutionary innovation—his Mark II innovation model. Here, think of ATT’s Bell Labs, which invented the transistor.
Software aside, we largely live in a world that combines both Mark I and Mark II innovation in a complex web that mostly favors larger firms. Typically, states promote radical innovation, often by funding basic research in university labs and their small firms spin-offs—classic Mark I innovation. But larger firms then typically provide those small firms with more funding to develop a commercializable product that their own Mark II R&D teams will perfect. While these smaller firms often get the publication glory, the larger firms usually get the bulk of patents and thus profits. Apple’s SIRI assistant, initially developed by a US-wide research team organized through the Stanford University’s Research Institute on behalf of the Defense Advanced Research Projects Agency (DARPA), was absorbed by Apple into its own software ecosystem.
If profits and R&D were evenly distributed across firms in each of our seven economies, these new technologies might not pose so big threat. But under the present combination of Mark I and Mark II innovation, a handful of firms account for the bulk of profits and R&D. For example, insulin accounts for roughly 7 percent of cumulative Danish goods exports for the period 2002–2021, with most of this coming from the pharmaceutical giant Novo Nordisk. 80 percent of Novo Nordisk’s revenue comes from sales of insulin and diabetes-related products, but 80 percent of Denmark’s workforce is in the service sector, which apart from Maersk-Møller and Legoland largely does not generate exports. Thus, the fate of Novo Nordisk has the potential to impact one of the country’s only significant export sectors.
Table 3 shows the degree to which this very narrow slice of firms dominates both profitability and R&D in our group of seven economies. The table thus captures the degree of vulnerability around Mark II innovation. Comprehensive data on Mark I innovation—which ranges from a handful of people tinkering in their parents’ garage to modestly sized start-ups with no revenue—is not available. As noted above, Schumpeter’s two pathways to radical innovation are more intermingled today than in the past, when vertically integrated firms were rather sealed off from both universities and small firms. These days, much Mark I innovation is often captured by the larger firms through acqui-hires, acquisition, or copycat innovation and litigation. Equally so, accurate, comparable data on the relative share of national profits by firm size is not available. While the $10 million annual operating revenue metric is biased towards fairly large firms, it does reach into the upper end of the long tail of SMEs that constitute the majority of firms in most countries. Moreover, SMEs typically have labor productivity levels one-third below larger firms.
Table 3: Firm share of cumulative national R&D and profits for high R&D firms, 2004–2020
Company
R&D share
Profit share
Denmark
Novo Nordisk
34.6%
35%
Finland
Nokia
77.6%
19%
Israel
Teva Pharmaceutical
43.9%
7.6%
Elbit Systems
9.1%
8.3%
Korea
Samsung Electronics
47.1%
36.6%
Hyundai Motor
8.3%
7.4%
Sweden
Ericsson
38.7%
7.9%
Volvo (trucks)
19.8%
10%
Switzerland
Roche
33.4%
23.7%
Novartis
29.7%
16%
Taiwan
Taiwan Semiconductor
12.6%
29.1%
Hon Hai Precision Industry
12%
14.2%
Source: Author calculation from European Commission data at https://iri.jrc.ec.europa.eu/data
These large firms dominate exports, and thus generate the foreign exchange needed to buy the considerable volume of goods and services that the seven economies do not produce locally. Given their small size, these economies cannot attain a domestic division of labor that generates the bulk of their consumption—hence their need for export. In all but one of the countries, firms with more than 250 employees account for more than half of exports. Denmark is the exception; there the share is so close to half that it makes no difference (data for Taiwan are not available, but as noted above TSMC’s large share suggests the pattern of large firm dominance is not much different). Table 3 understates the importance of the larger firms, as these typically account for fewer than 1 percent of the total count of firms, while firms with fewer than 10 employees account for over 90 percent.
As noted above, these few dominant firms largely explain why these societies capture a larger share of global profit than their share of global GDP (Table 1), which in turn explains why they are relatively rich societies. Success in generating high-value exports and their associated profits permits these societies to exchange a small volume of high-value exports for a much larger volume of lower-value imports. This disproportionate profit share reflects both pluck—local ability in the form of prior investments in R&D and human capital—as well as the broader dynamics of the modern economy.
These firms rely on their investments in R&D to maintain their competitiveness. Their investments in turn explain the above average share of R&D in their economies as compared with the larger economies of the G7. Table 4 provides four relevant pieces of information. It contrasts R&D spending and the number of full-time researchers in the population relative to the G7 countries. It also shows the high share of total R&D by business, as well as the disproportionate share of total R&D spending accounted for by both the largest and the fifth largest firms and thus their even greater share of business R&D (the picture is somewhat different in the case of Taiwan). Table 4 thus shows the degree to which future innovation—at least in terms of the Mark II innovation that turns Mark I innovation into a global product—rests on a very narrow foundation. We could construct an index of risk by multiplying the share of business R&D by the share of the top one or five firms, but this would give a false sense of precision. The central point here—looking at the last two columns—is one of amazing concentration of research spending.
The overlap of high profitability and profit share, export share and R&D share, is not accidental. It indicates past competitiveness and near monopoly or dominant positions in world markets. Profits fund the R&D that enables dominance and thus continued above average shares of global profits; those profits fund high levels of per capita income—among others, all those researcher jobs. And they fund, in some cases, extensive welfare states or at least state-education funding that generates the human capital those researchers possess, and which is the basis for past and potentially future dominance in high-tech sectors. Thus, for example, between 1991 and 2000, Swedish education spending increased by 2.1 percentage points of GDP to 7.4 percent, with half of that going to tertiary education. The Nordics have significantly higher literacy scores in standardized international tests than the rest of the rich countries, though Sweden has recently slipped back.4Data supplied by John Stephens, University of North Carolina.
Table 4: R&D intensity of economy, various measures, percent, average as indicated, ranked by column 1
R&D percent of GDP
FTE researchers per 1000 workers
Business percent of R&D
Top 1 share of Business R&D
Top 5 share of Business R&D
2010-2019
2010-2019
2010-2019
2005-2020
2005-2020
Israel
4.36
—
85.7
43.9
69.5
Korea
4.02
15.9
78.1
47.1
72.2
Sweden
3.25
15.2
69.5
38.7
68.8
Switzerland
3.17
8.6
71.2
33.4
78.3*
Finland
3.1
15
67.4
77.6
85.8
Taiwan
3.08
13.8
76.6
12.6
39.3
Denmark
2.99
14.1
64.7
34.6
59.2
Unweighted G7 Average
2.27
8.71
65.4
—
—
FTE = full time equivalent; * top 2 = 63.1 percent. Source: Columns 1–3 OECD Main Science and Technology Indicators https://www.oecd.org/sti/msti.htm; 4–5 EU data https://iri.jrc.ec.europa.eu/data
The franchise economy
The shift from the fourth (mass production) to the fifth (ICT) Schumpeterian wave involved changes in corporate strategy and structure that had significant knock-on effects. Chief among them, it boosted income inequality and increased the degree to which firms’ profitability depended on the legal regime around intellectual property (IPRs—patent, copyright, brand, and trademark). In the Fordist era, corporate strategy aimed at monopoly or oligopoly profits through control over large masses of physical capital arranged into continuous flow, assembly line systems. Profitability rested on running those systems at something close to their full capacity. This pushed firms to vertically integrate and negotiate peace with their typically unionized labor forces, which in turn reduced income inequality and funded internal research labs.
But as more and more firms adopted this vertically integrated, unionized structure, profits began to decline. Workers revolted against the monotony and pace of assembly line production, and decolonization enabled raw-materials producers to push up prices, disrupting energy and metals markets. Put simply, once everyone adopted a Fordist product and production structure, the world ran out of cheap oil and docile semi-skilled assembly-line workers.
Firms reacted to this militance by changing their corporate structure. They shrank their labor forces and opted to subcontract or offshore their low-wage, low-skill workforce. Similarly, they expelled physical assets—machines—used for producing undifferentiated goods into spin-off firms, as when GM and Ford created Delphi (now Aptiv) and Visteon as parts producers. At the same time, they began seeking more durable monopolies based on IPRs produced by a labor force high in human capital and supported by an army of subcontractors. This shift, which both coincided with and enabled the emergence of the fifth Schumpeterian wave, produced what I call a franchise structure.
In the franchise economy, lead firms with lots of human capital, few actual employees, and substantial intellectual property portfolios outsource much of production to two other generic types of subordinated firms. Second layer firms are typically more capital-intensive firms with some barrier to entry for their production processes. Third layer firms are labor intensive firms producing undifferentiated goods and services. The lead firm orchestrates almost everything in its value chain without bearing any of the risk of holding that physical capital or dealing with masses of workers. In our seven economies, the lead firms are all among the country’s largest, albeit sometimes hybrids of the top two layers. Profitability for those firms derives from their control of intellectual property rights. Nokia, for example, lives on as a producer of network hardware and software based on earlier and ongoing R&D that generated more than 10,000 US patents from 2000 to 2019. Unlike the barrier to entry posed by capital intensive production, patents are vulnerable to radical technological change and also radical change in the legal regime surrounding the patent.
While the shift to a franchise structure was good for firms with robust IPR portfolios and, by extension, for the high human-capital intensity of the workforce of our seven economies, it was less good for workers and firms producing undifferentiated goods and services. Downsizing meant shifting relatively well-paying jobs to low-wage countries, hollowing out the middle of the income distribution. Between 1998 and 2016, for example, Sweden’s industrial giants cut their workforce from 80,000 to 49,000 people. While younger labor market entrants into more IPR-based firms partly compensated for this, the loss of so many mid-level jobs has had broad socioeconomic effects, arguably contributing to the rise of anti-immigrant parties in the country. Nativist policies, in turn, threaten the ability of firms to attract the global talent they need to sustain R&D.
Coping with risk
Danish industrial policy with regard to pharmaceuticals illustrates the tensions around both Mark I and Mark II types of innovation strategy. Recent Danish governments have promoted Denmark as an “innovation country” and formed a “Disruption Council” intended to preserve the country’s economic position. Danish R&D is highly concentrated in the pharmaceutical and biomedical sector (Vestas’ windmill production and servicing provides a side bet on alternative energy, but Chinese competition squeezes profitability). A government-run public goods strategy supports the emergence of Mark I type firms in biotechnology, thus providing a “feedstock” for Mark II oriented Novo Nordisk. This strategy continues a long tradition of “extension” type services designed to bring new technology and best practices from universities and high performing firms to more traditional firms including manufacturing SMEs. It is supplemented with venture capital from the Danish Growth Fund (Vækstfonden). The policy has helped keep Danish firms largely at the technology frontier, producing a narrower gap between leading and lagging firms than in the rest of the OECD. But the challenge in pharmaceuticals is anticipating the bio-genomics revolution rather than adapting to it.
In cooperation with Novo Nordisk, the Danish government runs a cluster of data collection and dissemination organizations: the Danish National Genome Center (Nationalt Genom Center), the National Biobank (Danmarks Nationale Biobank under the State Serum Institute), and the overarching Royal Bio and Genome Bank. These centers leverage the comprehensive and diachronic data the state collects from all hospitals and practitioners on a large range of conditions and patient variables. For example, the Biobank currently has serum samples from nearly 1 million people and 25 million samples in toto. The Genome Center was able to establish a genomic sequence database for distinguishing Covid-19 variants within five days in March 2020. Quite apart from the value to Novo Nordisk (which accounts for 90 percent of Danish pharmaceutical employment and profits), the databanks also enable smaller biotech firms to access large volumes of data on relatively smaller (in terms of incidence) diseases and thus help them overcome one major research hurdle. Put simply, they generate and hold the data that machine-learning and AI driven R&D projects need to function. Novo Nordisk meanwhile acts as a central contractor with many smaller research-oriented firms—though these contracts generally choke off growth from Mark I innovation in favor of pre-emption by the lead firm. Overall, however, Denmark lacks indigenous AI and ML firms that might supply expertise to the entire sector, as compared with either Israel or Sweden.
Those countries display different strategies with different weaknesses. Israel’s huge defense related investment in software and sensor capacity created a vibrant Mark I-type tech sector. But Israelis doing that Mark I innovation typically sell their firms or technology to US Mark II type firms, as when Google bought the navigation firm Waze or when Intel acquired Mobileye, which develops autonomous driving technologies. The relative absence of big domestic tech firms explains Israel’s deviation from the broader pattern of profit share being above GDP share (Table 1). It also explains why so many Israelis—an estimated 100,000—simply migrate to Silicon Valley even though Israel’s so-called Silicon Wadi usually houses more start-up firms per capita than any other country. Both trends potentially inhibit a response to the AI and ML revolution in software. The Israeli state, meanwhile, has relaxed the stringent employment and production requirements it put in place to stimulate Silicon Wadi in the first place.
By contrast, Sweden has an abundance of large, mature Mark II type firms. Yet these have gradually hollowed out actual production in favor of simply generating intellectual property. The extreme case here is Volvo. Its old automobile capacity was sold first to Ford and then to the Chinese holding company Zhejiang Geely.5Not to be confused with AB Volvo, now largely a heavy truck manufacturer after spinning out Volvo Cars. Geely relies on Swedish engineering talent to design the new Volvo electric vehicle line (including Polestar), but production has largely shifted outside of Sweden. Similarly, Swedish pharmaceutical giants Pharmacia and Astra respectively ended up controlled by Pfizer (USA) and AstraZeneca (UK). As noted above, the big Swedish manufacturing firms have steadily reduced employment. Like Israel, Sweden is increasingly a hunting ground for foreign multinational firms looking for talented individuals. This sustains high-wage employment—at least for some. But it also means the profits end up somewhere else, and large Mark II firms that might anchor a research network are harder to form.
High tides
The sixth Schumpeterian wave, should it indeed appear, poses serious risks for the largest, export-focused firms of our seven economies. Presently, a narrow set of IPR-based firms in the Mark II model does the forward-looking investment in R&D that enables the transformation and scaling up of Mark I innovation required to catch that wave. It also generates both the jobs and the revenues needed to sustain a politically acceptable level of imports, employment, and growth in general. The potential inability of the big, highly profitable firms that anchor local research ecosystems to transition from their current production model to the novel production models emerging will have serious consequences.
This risk extends beyond the “innovator’s dilemma.” Domestically, the loss of core manufacturing jobs in the second layer of the franchise economy has provoked populist backlashes. In both Israel and Sweden, this has empowered parties hostile to state-led industrial policy favoring highly paid knowledge workers. Externally, growing geopolitical tension between the United States and China has prompted efforts to reshore or “near-shore” the ICT sector, particularly semiconductor production. All told, this probably tilts the global playing field towards firms from the larger and more geopolitically powerful countries. As noted above, those firms already fish in the human-capital pools of the seven economies of our study, potentially undermining the survival or emergence of Mark II firms that anchor local R&D and production ecosystems. If the winner-take-all nature of the franchise economy continues, these older firms must run fast simply to stay in place.
For the pawns of the global economy—smaller economies without national champions like Nokia or Samsung, and without oil-fund assets as in Norway—these challenges are even more pronounced. They enter this race with greater headwinds, weighed down by external debt, relatively untrained workers, and, in the worst cases, an over-reliance on unprocessed raw materials exports.
The energy system that underpins contemporary life is marked with blindspots. Take the fossil fuel sector. Facing simultaneous existential and geopolitical vulnerability—due to Russia invading Ukraine, advances in renewable energy, and the climate imperative—there is profound uncertainty about how demand for fossil fuels will transform over the next five to seven years, the time it takes to bring a new gas or offshore oil field online. On the supply side, that uncertainty is matched by the lack of knowledge and monitoring of physical flows of commodities—let alone the kind of detailed information needed to model the ways that geopolitical, climate, and technological disruptions may play out.
Climate campaigners aim for an end to fossil fuel extraction—the minimum requirement to reduce catastrophic and irreversible climatic harm. But with much built infrastructure still relying on fossil fuels, unexpected supply shocks roil households, firms, and governments. New analysis from Isabella Weber, Jesus Lara Jauegui, Lucas Teixeira, and Luiza Nassif Pires shows that energy—in particular petroleum, coal, and oil and gas extraction—are intrinsically more important to inflation than other prices.
What if policymakers could assess inflation with the knowledge that it is driven partly by geopolitical shocks with an unknown timeframe to resolution, and can be approached by policy tools, poured concrete, and steel? These micro considerations do not tend to filter up to the macro modelers whose work informs monetary and fiscal policy. The consequences are significant. Unnecessary pain caused by misdiagnosing the drivers of inflation, and failing to employ targeted tools in response to it, narrows the political space needed to overcome systemic issues and in particular to act on climate.
Energy prices going to the moon are a problem, and we need to decarbonize while some fossil fuel extraction continues. The dilemma is how to navigate these tensions while transitioning a system that was already lacking in information in its previous state. Relying on opaque and volatile commodity markets is one thing; relying on those markets while they enter a messy twilight accompanied by geopolitical instability and climate impacts is entirely another.
To understand how fossil fuel commodities may become expensive, abundant, or inaccessible due to geopolitics, energy policies, climate impacts, and technology requires a granular view. Which assets are likeliest to be stranded? If we need new investment, where exactly is it required? Without this kind of detail, the simplistic global demand models used by policymakers, capital allocators, and influential experts will not be able to grapple with an emerging multipolarity, breakdowns in trading relationships, and climate shocks.
Facts on the ground
After working on several coal and coal-related bankruptcies in the 2010s, I realized that the state of underwriting was far from adequate, and that this was largely attributable to the sorry shape of commodity analysis. Coal is plentiful, and no one is concerned we might run out of it. Despite this lack of any plausible shortage, the volatility persisted.
On-the-ground research and contact with policymakers made the regular implosions and explosions of the coal price more comprehensible. Self-sufficiency and energy security were growing priorities for China, for instance, which was rapidly expanding its logistical networks to better exploit its own resources and expand its renewables output. On a global basis, coal supply did not change much year-to-year on a global basis. But on a local basis—the only level that matters at the end of the day for someone who needs coal—circumstances could change quickly, because “the market” was something of a fiction. Sure, there might be a lot of cheap fuel thousands of miles away, but unless it can be delivered it’s of no use. One port or rail addition and the whole situation is changed. This is a fact of life for bulky energy commodities that, unlike gold, you cannot just put in your pocket and move.
Intelligence about the physical world of resources and commodities mostly comes from private consultancies with opaque methodologies, whose business model is to manufacture consent to drill more holes and agencies that, while ostensibly public, don’t reveal their model workings and assumptions.
The temperamental nature of the coal industry led me back to some old university textbooks in operations research to see whether anybody had developed ways to measure the impacts of changes in physical transport networks. If there were a way to get this knowledge, you could answer straight forward questions like: “What is the impact of this piece of infrastructure?” Getting down to literally concrete things and their measurable impacts could guide your predictions, rather than the editorializing of China-watchers.
At best, the actually existing plumbing structures of various commodity markets were vastly underappreciated. At worst, they did not seem to exist for researchers. There was some literature on oil market infrastructure, but it had fallen out of fashion since the 1980s. Gas networks were well covered within national boundaries, but cross-border coverage was scant even as a global trade in liquid natural gas had emerged. Europe’s gas regulator, for example, had not modeled a Russia gas cutoff. Despite still being a major fuel source, coal was well analyzed as a seaborne market, but only on the national level—the typical analysis treated each country as a blob with no internal transport requirements or other constraints.
It seemed that years of relative price stability and fossil fuel oversupply following the boom in natural gas production from shale in the 2010s had allowed our understanding of sourcing and moving commodities to weaken, just as the computational power to do so systematically became cheaper and more available. A decade after a financial crisis ravaged the world, we now have regular and rigorous stress tests for banks, but nothing for any of our other markets, neither energy, food, nor other critical commodities.
Together with researcher Jorrit Gosens, I started to look at developing a network analysis methodology that could begin to fill these gaps. Despite the accessibility challenges of data on China—which range from not cheap to not available at all—we managed to map all of China’s coal mines, steel plants, and infrastructure to understand where China’s infrastructure boom was taking their coal imports. Modeling this granular data showed that China’s imports of coal are likely to fall substantially under various plausible scenarios, even if the country’s total amount of coal burnt doesn’t decrease much. That has implications for coal exporting countries, Indonesia and Australia in particular.
While we were engaged in this work, the Ukraine conflict went from Russian kayfabe to fact, and the importance of modeling commodity markets as logistical networks became even more urgent. No one was sure how much Russian supply in anything—coal, wheat, oil, or metals—could be rerouted, and how much of it would vanish.
We had been working on more graphical models to take account of China’s informal ban on Australian coal, and that tooling and framework became ideal to make sense of the disorder following the invasion of Ukraine. How quickly can China and Russia put pipelines across the Amur River at their mutual border to relieve Russia’s oil glut? How much coal capacity can Mongolian rail networks take? Are China’s gas pipelines from Russia to China fully utilized? Will Chinese imports of LNG remain low all winter?
Neither China nor Russia is tipping their hand on these matters, leading to significant uncertainty about what happens next. Uncertainty is risk. Risk hurts liquidity and asset prices, and in turn confidence and growth. Mainstays of forecasting such as global demand curves are all well and good when commerce happens freely, but they are irrelevant when sanctions are flying back and forth and the Black Sea becomes a shooting gallery. When that happens, the established models used during the good old days of free commerce in energy products become a poor guide to the future.
While national governments and energy authorities may not be responsible for all commodity markets globally, they are likely to be held electorally responsible for their effects, particularly inflation and cost of living pressures. Gritty fundamental research is now very high stakes.
The fossil sector and the environmental movement are sticking to their respective positions—namely “drill more holes” and “no new holes.” Neither is able to explain what the path forward might be under our new geopolitical circumstances in terms of prices, emissions, and energy capacity over time, or how to assess the security tradeoffs of those choices. It’s difficult to block new gas development when prices are as high as they are now, but similarly, it’s naive to assume that renewables won’t be able to meet a lot of the demand. If there is one truth in all of this, it is that local, non-fossil sources of energy are the only strictly domestic strategy available unless you want to significantly expand coal burning.
Seeing the grid
Such blindspots do not plague electrical grid modeling. Within the boundaries of a regulated transmission area such as California’s Independent System Operator or the Australian National Energy Market, there is extensive research and data that are systematically updated with each new piece of legislation. The path to “electrify everything,” as Saul Griffith wants us to do, is clear and getting clearer. We know electrical engineers can monitor complex networks because if you live in the global North, you likely expect “three nines” of reliability—99.999 percent uptime of the grid. Grids are broadly well managed and have accountable regulatory bodies with extensive disclosure, a marked contrast to commodities.
There is one problem: limited information on the feedback loop from grid plans to global fossil prices and back again. This leads to a great deal of confusion. Most grid models assume some elasticity between coal and gas fuel-switching in power fleets—if gas prices are high you run more coal and if coal prices are high you run more gas. But what happens when every energy provider gets their gas and coal from the same markets? Heavily indebted players often have inelastic demand when they are close to their limits, and crowding leads to excessive volatility. That is the mess we are now in.
Modeling physical flows of fossil fuels is not inherently challenging, nor does it have all the challenges of maintaining instantaneous supply at all times and within a tight frequency range: there are vastly more challenging things done by power engineers every day of the week. Vast regions can now be analyzed in geographically precise detail, and projects like Openmod provide open source tooling for power grid decarbonization. Extending this to fossil demand would require some effort, but much less than what has already been expended thus far. What is more, using open source frameworks circumvents the general tendency of fossil fuel consultancies to provide projections that suit the assumptions of their customers, which are principally fossil energy businesses. There is a profound weakness in this space—customers often ask questions, hint at the answers they want, and are presented the conclusion with proprietary data, limited capacity to check the work, and no code review. Open modeling frameworks and open data provide a way forward with richer discourse around future pathways and risks.
Questions like, “What happens if the Straits of Hormuz are shut?” and “What will the Power of Siberia 2 pipeline between Russia and China mean for LNG flows?” become answerable rather than merely fodder for retired politicians to pontificate about on CNN. Further questions as to whether, say, centering the US’s entire LNG export capacity in Louisiana’s Hurricaine Alley is wise with respect to climate models, also now have clear answers. The future will remain unpredictable, but we can at least get some sense of where the fossil pinch points are for the near term, not to mention how much—if any—incremental new capacity will be required before we can say goodbye to fossil fuel for good.
In a world that is once again experiencing resource scarcity, certainty not only saves money, it also saves monetary policy. Central banks are concerned about their credibility on inflation. How can anybody have credibility without having first evaluated what the risk profile of future shocks might be?
The future of energy looks different from today’s picture. Energy will be sourced much closer to where it is used, and much more from renewables, nuclear, and geothermal. This will mean a lot less trade across pipelines and in ships, and less exposure to geopolitical crisis, though perhaps more exposure to weather.
Policymakers, investors and the public need an analytical framework that can include all the things that can happen to physical assets—not least of all wars and embargoes. With that work completed, we may get a clearer view of the consequences of moving slowly on the energy transition.
“The systemic, long-term nexus between the political elites and big business will not go away anytime soon,” wrote journalist M. K. Venu in 2015. Writing in the aftermath of Obama’s second visit to India, Venu suggested that “crony capitalism” had to be grasped in a deeper sense to reflect not the odd favors bestowed on this or that industrialist by the government of the day, but the system that cemented the ties between state and capital. In this case, it was a handful of family-owned businesses that knew they could always depend on India’s governing class, starting with the prime minister. Venu cited a revealing example of this bond. “At the Modi-Obama reception at Rashtrapati Bhawan [on Sunday 25, 2015], about two dozen industrialists had been invited and were seen standing in a queue to greet the US president. About six to eight of those present collectively owe close to Rs. 3.5 lakh crore1$56.5 billion at the exchange then prevailing to banks, mostly public sector undertaking (PSU) banks. The banking industry in India has about Rs.5 lakh crore 2$80.7 billion as total capital and nearly 70 percent of it is exposed to just a half a dozen industrial houses. Technically, if these business houses were to go bust, 70 percent of India’s banking capital will get wiped out. In short, they are too big to fail. So they have no worries really, as the system sustains them.”3M. K. Venu, “Lalit Modi is a Small Symptom of the Continuing Malaise of Crony Capitalism,” (<)em(>)The Wire(<)/em(>), June 16, 2015.
In what follows, I present a precis of the evolution of Indian big business over the last two decades, starting with a fact which is hardly ever foregrounded, namely, that the business families who formed the mainstay of industrial capitalism in the country for a whole three or four decades after Independence have either disintegrated or have been disintegrating and will soon cease to exist as coherent entities, let alone cohesive ones. Next, I shall present the results of an exercise that involves looking at the biggest non-banking companies in the country (both listed and unlisted) in terms of who actually owns them and of the different categories of ownership we can divide them into. Here the chief result is that since the 1960s, when both R. K. Hazari and Mike Kidron wrote fine studies of big business, there have been massive changes in the Indian corporate sector.4R. K. Hazari, (<)em(>)The Structure of the Corporate Private Sector: A Study of Concentration, Ownership and Control (<)/em(>)(London, 1966); Michael Kidron, (<)em(>)Foreign Investments in India (<)/em(>)(London, 1965). Dominance no longer lies with the fabled large business houses of the past but with an entirely new breed of capital. In section three, I shall turn to the cycles that span first a major boom (one of the most rapid periods of growth in Indian manufacturing) in the 2000s and then the slowdown that came to grip most areas of private business for the greater part of the last decade. The slowdown began in 2011 and shows no obvious sign of letting up even today. As the quote from Venu suggests, the banks are central to this sharply fluctuating picture, and their abject prostration before private capital casts doubt on whether any such thing as “finance capital” can even be said to exist in India’s economy. In the final section, I offer an alternative perspective that breaks with the shallow characterization of “crony capitalism” in favor of a deeper reflection on what we are up against.
Splits, divisions, and decline
Over the course of the last decades, the family-controlled corporate groups that once dominated Indian capitalism have to a large extent disintegrated. There are two main causes for this. First, Indian corporations have been plagued by spectacular failure, resulting in the rapid decline of tycoons like Vijay Mallya (Kingfisher Airlines), Subhash Chandra (Zee TV), and Anil Ambani, of families like the Dhoots (Videocon), Nambiars (BPL), Mafatlals (Mafatlal Industries), and Ruias (Essar), and of once leading companies like Ranbaxy. In the case of Ranbaxy, the death of Parvinder Singh, the founder’s son, led to a decade of gross mismanagement by his two sons, both of whom are currently serving six-month jail sentences. Ranbaxy is today a subsidiary of Sun Pharmaceuticals, the country’s leading drugs company, while the Essar empire has been divided between Rosneft (oil) and ArcelorMittal (steel). Videocon’s assets have been acquired by Anil Agarwal (Vedanta), and Subhash Chandra’s flagship is now in Sony’s hands. With very few exceptions, these were not situations brought about by conflict within families. What drove them to insolvency was some combination of strategic miscalculation (Mallya launching Kingfisher with little grasp of the airline industry; the Mafatlals buying out Shell’s stake in Nocil at considerable cost), formidable competition from global players (Videocon and BPL in consumer electronics when LG and Samsung were making their entry), and downright fraud (the siphoning of loans)—all coupled, of course, with gargantuan levels of debt that the state-owned banks had no compunction creating.
More common than these instances of spectacular failure have been the divisions that have marred Indian corporate history for the past several decades. Not all divisions within India’s business families have been acrimonious. The Singhanias, Goenkas, Thapars, and Jindals would all see asset divisions (between sons) that engendered no obvious resistance. The latest of these as recently as 2013. The conflict that garnered the most public attention was the bitter estrangement between the Ambani brothers (Reliance Industries, India’s leading conglomerate), which, one writer has argued, “was largely about wresting control over reserves of natural gas that lie below the ocean bed” in the Bay of Bengal. The first signs of this came in 2004 when Mukesh Ambani admitted there were differences over “ownership issues.” What gave this conflict its peculiar shape, to say nothing of its intensity, was that Reliance was India’s leading example of a substantial, vertically-integrated enterprise and, as Paranjoy Guha Thakurta argues, their father Dhirubhai believed “it would be next to impossible to divide the Reliance group that had now become consolidated into one monolithic entity. He thought institutional and individual investors would strongly resist a split,” which may well be why he died without having drawn a will.5See Paranjoy Guha Thakurta, (<)em(>)Gas Wars: Crony Capitalism and the Ambanis(<)/em(>), revised edition(New Delhi, 2016), pp. xx, 6, 63–4. In 2010, the Supreme Court gave the older brother Mukesh control of the gas business.
Not all “family divorces” have been as straightforward as the Ambanis’. Some have involved a very large number of claimants. Like Dhirubhai, Gujarmal Modi, the founder of the Modi Group, who had five sons and six daughters, died intestate in 1976, and the sprawling assets of the group were left to the de facto control of his brother Kedar Nath, who had the interest of his own three sons in mind. The bitter family battle that ensued forced the financial institutions to intervene by proposing a truce that divided assets between the two sides in a 60:40 ratio. But, as one writer notes, “What everyone misjudged was the difficulty that the group would have in disentangling the cross-holdings within its companies.”
The group’s shareholdings comprised a complex web of holding firms in which every brother had a stake and that made it virtually impossible for family members to go their own way, even if they wanted to… For the FIs, the family battle served a double whammy. Not only were they stuck with a messy state of affairs within the companies, the Modis also refused to repay loans. They said that the cross-holdings of the various family factions were so complex that the liability of each of the brothers could not be fixed until the division of property was effected. So, the FIs blacklisted the entire group, complicating matters further.6Shyamal Majumdar, (<)em(>)Business Battles(<)/em(>), from the excerpt published in “Everything you Wanted to Know about the Modi Business Family Feud,” (<)em(>)Firstpost(<)/em(>), August 5, 2014.
The investment companies that R. K. Hazari had warned government about in Nehru’s last years have always been at the heart of the system of corporate control by India’s family conglomerates.7R.K. Hazari, “Ownership and Control: A Study of Inter-Corporate Investment,” (in 3 parts) (<)em(>)Economic and Political Weekly (Bombay)(<)/em(>), vol. 12, nos.48-50, November 26, 1960–December 10, 1960. Reliance was said by one finance director I interviewed alongside Gautam Mody many years ago to have 400 investment companies operating from a single address.8Jairus Banaji and Gautam Mody, “Corporate Governance and the Indian Private Sector,” Oxford Department of International Development Working Paper, 2001: https://www.qeh.ox.ac.uk/publications/corporate-governance-and-indian-private-sector. When asked why so many investment companies were needed, cross-holdings were cited as a major reason for their existence.
Another case of protracted family conflict which became impossible to resolve thanks to a convolution of cross-holdings was that of the Bangurs, Kolkata Marwaris whose fortunes burgeoned when they acquired the substantial jute interests of a British managing agency in 1954. In 1987, a deal to divide the family businesses three-ways came unstuck because the shareholdings were impossible to unscramble. The Bangurs were said to have around eighty investment companies but it proved impossible to transfer shares by exchanging those between battling cousins.9Kamaljeet Rattan, “Bangur Family Members Bicker about Dividing Assets,” (<)em(>)India Today(<)/em(>), January 31, 1989, updated October 17, 2013. This necessitated a further division of the group in the 1990s. As one journalist put it:
The family split into five factions due to differences among members of the younger generation…Under the terms of separation, the cross holdings of the companies were to be transferred at zero-value. Each group would have unencumbered control of the companies under it…And the group would be bound together by old ties and their joint holdings in real estate, charitable, and religious trusts. (Corporate watchers felt a total recast of the management system was needed.) This is unlikely to happen in the near future because the factions are racked by internal rivalries.10“The Problems of an Ageing Tree,” (<)em(>)Business Standard(<)/em(>), February 26, 2013.
The Hindujas, Chhabrias, and Wadias are other more recent examples of families where brothers, cousins, fathers, and sons have been embroiled in battles. In the case of the Hindujas, it was said that “the family has been revealed to be deeply divided after court proceedings spilled into the open,” and “the stage may now be set for the break up of one of the biggest conglomerates in the world. With dozens of companies—including six publicly traded entities in India—the Hinduja Group employs more than 150,000 people in thirty-eight countries.”11“Billionaire Hinduja Brothers Call Truce on Bitter Family Feud,” (<)em(>)Bloomberg(<)/em(>), November 12, 2022.
The transformation of the corporate sector
Table 1 presents a break-up of 270 listed non-banking companies. The top 100 companies here account for almost 90 percent of the aggregate net sales of all 270 companies. They are the backbone of the corporate sector. Within the top 100, public sector companies account for 44 percent of all sales, even though their share of the number of those firms is just 14.4 percent, showing that enterprises under government control are larger than average.
Table 1: The 270 largest listed non-banking companies: Numbers and concentration ratios by type of ownership (FY22 net sales in ₹ crore)
Ownership category
No.
Net sales in FY2022
share (%)
PSUs
39
2,202,380
40.1
LBH
47
848,208
15.4
First wave post-1947
14
187,195
3.4
1950s–70s
26
152,257
2.8
New Capitalists (total)
102
1,595,154
29.1
conglomerates
37
1,043,398
stand alone
65
551,756
Foreign firms
31
289,603
5.3
Independent
6
188,365
3.4
Other
5
26, 956
0.5
Total
270
5,490,118
100.0
Explanations: PSUs = public sector undertakings, viz. state-owned enterprises; LBH = ‘Large Business Houses’ of the traditional type that once dominated Indian business, groups like the Tatas, Birlas, Mahindras, and Singhanias; First wave of capital post-1947 refers to companies like Cipla, MRF, and Bajaj Auto that were started by families who can’t be said to belong either to the “traditional” business houses or to the wave of newer, stand-alone entrepreneurs that came later, post-1980; 1950s-70s = Stand alone firms floated at any time in the 1950s, 1960s or 1970s; New Capitalists = business groups that have emerged or companies that have been floated since 1980; ‘Independent’ = firms like Larsen & Toubro, ITC and HDFC which are not part of any business group; Others = Older houses that have survived by modernizing.
Source: Data is based on the raw “net sales” data available at moneycontrol.com,12See (<)a href='https://www.moneycontrol.com/stocks/marketinfo/netsales/bse/index.html'(>)https://www.moneycontrol.com/stocks/marketinfo/netsales/bse/index.html(<)/a(>) but excludes both banks and insurance companies, though not companies offering financial services other than banking (in India these are called NBFCs).
Strikingly, of the twenty top business houses that were studied by R. K. Hazari in the mid-sixties, only nine figure in this group of 270 listed companies. Half of those twenty business groups have disappeared. Once dominant business groups like the Thapars, Sahu Jains, Scindias, Mafatlals, Sarabhais, and Kilachand no longer figure anywhere, even among as many as 270 listed companies. (The Sahu Jain family owns Bennett, Coleman which is the unlisted holding company for the Times of India and related concerns.)
Numerically, the largest group is what I’ve called the “New Capitalists,” which are business groups or firms that have emerged since the 1980s. Within this group a distinction must be made between firms that belong to the newer conglomerates such as Ambani’s Reliance or the Jindal Group, and firms that largely stand alone, outside any conglomerate structure. Some of these, like Infosys, are hugely successful but most are smaller-sized establishments in software services, pharmaceuticals, logistics, real estate, infrastructure, and so on. Some are in niche markets like renewable energy, water management, and off-highway tires. The sixty-five companies of this latter type were founded by quintessential “first-generation capitalists” who are usually described as “entrepreneurs.”
In terms of listed company sales, the dominant shares are still held by Public Sector Undertakings (PSUs), followed by New Capitalists and, some way behind them, by the few remaining large business houses of the past that have retained their leading position despite vastly greater levels of competition since the 1990s. (These are the Tatas, the Aditya Birla Group, Mahindras, and the Chennai-based Murugappa Group, among others.) Between them, these three types account for close to 85 percent of the aggregate sales of big companies.
New Capitalist firms which are part of conglomerates are on average over three times bigger than sixty-five New Capitalist firms that are “stand alone.” The latter also have the highest percentage of non-manufacturing-related businesses of all categories in the sample. The thirty-seven companies that form some part of the “new conglomerate” groups belong to a total of thirteen business groups (Mukesh Ambani, Jindals, Sunil Mittal, Anil Agarwal, Gautam Adani, Hindujas, Mehtas, Piramals, Balkrishan Goenka, Anil Ambani, and the various groups named after R.P. Goenka (he died in 2013), Sanjiv Goenka and the Gallas of Amara Raja). Of the forty-seven companies controlled by the more traditional large business houses, fourteen belong to the Tatas, seven to the Aditya Birla Group, and five to the Murugappas. The remaining twenty-one are dispersed across another fourteen business houses, so here the pattern is more concentrated, suggesting that there is greater polarization within this category. The ten biggest private sector groups and firms account for 56.3 percent of the aggregate net sales of the private sector; the top two (Reliance and Tatas), a considerable way ahead of the others, account for just over 25 percent.
New Capitalists are the most fervent supporters of Prime Minister Modi. This is the case among both bigger groups (Ambanis, Adani, Sunil Mittal (Airtel), Anil Agarwal (Vedanta), the Hindujas, and Sudhir Mehta of the Torrent Group) and some smaller and less solid ones (e.g., the media tycoon Subhash Chandra who recently lost control of his flagships, with Zee Entertainment passing to Sony). Political funds are mobilized through so-called Electoral Bonds, and doubtless the groups just mentioned are major contributors to those, though the public will never actually know, since there is zero transparency about who contributes by way of the Bonds. (The anonymity of donors is a strict rule of the scheme, which has so far generated political contributions worth $1.34 billion since March 2018.)
State enterprises remain crucially important despite underinvestment and the massive hostility that’s been drummed up against them over the past three decades. That the Modi government forcibly removed state-owned Hindustan Aeronautics Limited from the Rafale combat aircraft deal with Dassault Aviation in 2015, making way for a businessman who was sliding rapidly into bankruptcy, is one example of the way public policy is being shaped with respect to major companies.13See Ravi Nair and Paranjoy Guha Thakurta, (<)em(>)The Rafale Deal: Flying Lies?(<)/em(>) (2022) for the most substantial account so far.
As Table 1 shows, the Foreign Company share of total sales in India is a mere 5.3 percent. This statistic may appear to run against clichés about the oversized role of multinationals in developing economies like India’s. However, Table 1 concerns only listed companies and the picture changes dramatically when we turn to an analysis of unlisted firms.
As Table 2 shows, out of the 172 unlisted firms analyzed there, no fewer than seventy-eight (45.3 percent) are foreign companies with a collective share of 44.2 percent of the aggregate total income. This reveals the extent to which newer multinational entrants in the Indian market (software services giants, for example) have a strong preference for remaining private companies, doubtless because they are under no compulsion to raise capital in the equity market. By contrast, both the bigger state enterprises and large business houses have a clear preference for listing.
Table 2: 172 unlisted non-banking firms based on Dunn & Bradstreet’s “Premier 200 Unlisted Companies”: Numbers and concentration ratios (FY21 total income in ₹ crore)
Ownership category
No.
total income
share (%)
PSUs
17
290,013
12.8
LBH
12
93,358
4.1
First wave post-1947
5
31,562
1.4
1950s–70s
10
100,037
4.4
New Capitalists (total)
47
714,038
31.4
conglomerates
16
399,658
stand alone
31
314,380
Foreign firms
78
1,004,119
44.2
Independent
2
23,638
1.0
Other
1
14,088
0.6
Total
172
2,270,853
100.0
The total combined sales of both listed and unlisted companies comes to ₹7,760,970 crore, which at ₹80 to the US dollar is equivalent to $970.12 billion, just short of a trillion dollars. Taking “total income” figures as a proxy for sales for the fiscal year of 2021, the combined sales totals of these various groups (in ₹ crore) is as follows:
PSUs
2,492,393
32.1
LBH
941,566
12.1
First wave post-1947
218,757
2.8
1950s–70s
252,294
3.3
New Capitalists
2,309,192
29.8
Foreign firms
1,293,722
16.7
Independent
212,003
2.7
Other
41,044
0.5
On this reckoning, the three leading categories of firms in the Indian corporate sector then become (1) the state enterprises, (2) the New Capitalists, and (3) foreign companies. Between them, they account for close to 80 percent of the combined sales of listed and unlisted companies taken together. The large business houses of the past are no longer dominant as a group, since only a handful of these old, restructured, and now more tightly centralized conglomerates even figure in the calculations above.
End of the affair: A debt-fueled boom and its aftermath
With the exception of a sudden sharp drop in the last two quarters of FY2009, the second half of the first decade of the new millennium saw an investment boom dominated by the private sector. A boom was clearly gathering momentum by the time the first of the two coalition governments headed by the Congress Party (UPA 1) came to power in May 2004. The growth rate of manufacturing, which had slumped to 2.9 percent in FY2002 (from an earlier peak of 14 percent in FY96), was 6 percent in FY2003, 7.4 percent in FY2004, and 9.2 percent in FY2005. The remaining nine years of UPA rule saw the boom cresting in FY2007, then breaking momentarily to register the immediate effects of the global financial crash, before moving sharply upwards in a V-shaped recovery as the RBI loosened monetary policy, and finally beginning a sustained fall until manufacturing actually contracted in the UPA’s last year in office.14The calculations are based on updated data on manufacturing growth in the (<)em(>)Economic Survey(<)/em(>), from (<)em(>)ES 2003-04 (<)/em(>)to (<)em(>)ES 2016-17(<)/em(>). The “new series” data is generally thought to overstate actual growth by about 2.5 percentage points.
2005–2006
9.1%
2006–2007
12.5%
[peak of the boom]
2007–2008
9.0%
2008–2009
3.4%
[slump in the last 2 Qs]
2009–2010
10.9%
2010-2011
8.9%
2011-2012
3.0%
[sharp fall; start of slowdown]
2012-2013
1.3%
(4.8% new series)
2013-2014
–0.8%
(3.6% new series)
2014-2015
2.3%
(3.9% new series)
2015-2016
2.0%
(3.0% new series)
Among Asian countries India was exceptional in having family businesses with extensive exposure to capital-intensive sectors such as steel, power, and telecoms. The trouble with this sprawling conglomerate model is that the promoters themselves, especially the newer capitalists, had no “skin in the game.” As one analyst explained:
Bankers typically wanted tycoons to put in some of their own funds, not only to provide an incentive to ensure the project went well, but also because it would be used to absorb losses if things went wrong. But Gupta discovered that this equity component was often a mirage. The tycoons deployed a clever deception, telling Bank A they were putting equity into a particular project, when the money had in fact been raised as debt from Bank B, as part of the financing of an entirely different project, and then quietly transferred over. Both Banks A and B were kept in the dark, while the tycoon had to put in no money of their own.15James Crabtree, (<)em(>)The Billionaire Raj: A Journey Through India’s New Gilded Age (<)/em(>)(London, 2018), pp.186-7.
Ashish Gupta was the analyst who in 2012 set alarm bells ringing about the mounting bad debt problem of the state-owned banks. In his own story of India’s reforms, published in 2020, the deputy chairman of the Planning Commission of that time confirms that this is what was happening with infrastructure projects that were being financed with shorter maturity borrowing from the banks:
Some time in 2011, Gajendra Haldea brought to my attention that private investors were negotiating large loans from public sector banks by estimating project costs in loan applications much above the approved costs [for] the project…The banks were legally free to accept a larger project cost and lend more if, in their judgment, they believed the project could service the debt…Unduly high levels of borrowing raised the suspicion that unscrupulous promoters may be siphoning off the surplus amounts from the project and then recycling them back as their own equity contribution.16Montek Singh Ahluwalia, (<)em(>)Backstage: The Story Behind India’s High Growth Years (<)/em(>)(New Delhi, 2020), pp.317-18. Haldea was an official in the Ministry of Finance with some expertise in how PPP projects worked.
The boom saw a very substantial expansion in listed companies. At the end of 2010, a quarter of all family-controlled firms that were listed had done so during the 2000s boom.17Credit Suisse, (<)em(>)Asian Family Businesses Report, 2011(<)/em(>) (October 2011), Table 2, p.6. In its section on India the report notes “Profitability of family businesses has fallen since 2007 due to their (<)em(>)significant investments in fixed assets(<)/em(>)”, and also that “Net financial leverage increased dramatically from the early part of the decade into the boom phase driven by a sixfold growth in gross debt leverage. Both net and gross debt ratios remain significantly above that of regional peers.” (p.30). But different sectors and layers of capital responded to the boom in their own way. The tycoon-controlled, self-styled “diversified conglomerates” that hadn’t been in existence for much more than a decade would account for the bulk of the bad loans the banks found themselves stranded with when the boom had passed for good. Other sectors of capital exemplified other strategies. In software services, firms like TCS (Tatas) saw an exponential growth in employee numbers, with India’s IT Majors taking on tens of thousands of employees every year, at least until the financial crash of 2008.18S. Ramadorai, (<)em(>)The TCS Story and Beyond (<)/em(>)(New Delhi, 2011), p.142. Their chief markets were and remain in the US and UK.
Global acquisitions were also a marked feature of the boom. Ratan Tata’s drive to make Tata a global brand involved a spate of acquisitions that included Tetley (2000), Daewoo Trucks (2004), Brunner Mond (2005), Corus (2007), and Jaguar Land Rover (2008). Tata eventually paid $12.7 billion for the Anglo-Dutch steelmaker Corus, a deal that the late Cyrus Mistry would later describe as “overpriced.” Kumar Mangalam Birla, head of the largest and most successful of the various Birla groups, acquired US-based aluminum can maker Novelis in 2007, making Hindalco the world’s largest aluminum-rolling company. Lakshmi Mittal, who is not from one of the traditional business houses, acquired Arcelor in 2006 to create the world’s second largest steel company. ArcelorMittal is a good example of a foreign-headquartered Indian-origin global giant that has now entered the Indian market to mop up the distressed assets of families such as the Ruias that went bust in the downturn of the 2010s.19The Ruias themselves have recently claimed that Essar is now debt-free, having repaid $25 billion from the sale of major assets over the past five years.
The expansion of private capital into infrastructure (via so-called public-private partnerships), and into asset-heavy sectors such as steel and energy, was financed by debt. The years from 2007 to 2012 saw a steep growth in borrowings. The moment of truth came with Credit Suisse’s 2012 report titled House of Debt, which argued that Indian banks had increased their loans by 20 percent since 2007, largely to a select group of corporate entities. The ten groups mentioned (Adani, Essar, GMR, GVK, JSW, JPA, Lanco, Reliance ADAG [Anil Ambani], Vedanta, and Videocon) had seen their total debt level jump five times in the past five years, to equal 13 percent of all bank loans and “98 percent of the net worth of the banking system.” The report concluded that “the concentration risk is high”:
(1) all banks appear to have high exposure to the same few groups; and (2) investments of most of these groups are in similar sectors and projects (primarily, power and metals) and many of them may be stressed. The asset profile of many of these groups is similar, with infra[structure], and to a large extent, power assets driving up investments in the past few years.20Credit Suisse, (<)em(>)House of Debt(<)/em(>), August 2, 2012 (by Ashish Gupta and Prashant Kumar), p.3.
As it turns out, in the years that followed no fewer than seven out of the ten groups analyzed in this report became the subject of insolvency proceedings initiated by banks. Meanwhile, a report commissioned by the Reserve Bank in 2014 soon after Raghuram Rajan became governor could refer to a “steep erosion” in the asset quality of the state-owned banks. It noted that, over the past year, “loan asset quality in banks has deteriorated at a frightening pace.”21Reserve Bank of India, (<)em(>)Report of the Committee to Review Governance of Boards of Banks in India(<)/em(>) (May 2014), pp. 4, 19. The report’s author P. J. Nayak suggested that the key underlying issue was the way the public sector banks were governed. In a less formal setting, talking to the Financial Times journalist James Crabtree, he was less restrained. “I met with a number of retired chairmen of banks, and the kind of stories they told me about dishonesty in the banks were really extraordinary,” Nayak told Crabtree. “There is corruption in the system, and there is no point pretending otherwise.”22Crabtree, (<)em(>)Billionaire Raj(<)/em(>), p.193.
The slowdown that began in 2011 has shown no signs of subsiding. Manufacturing remains as sluggish as ever, and major foreign companies such as Ford, GM, and Holcim have exited India. Millions of manufacturing sector jobs have been lost.23The best short survey of the decade is R. Nagaraj, “Understanding India’s Economic Slowdown,” (<)em(>)India Forum(<)/em(>), January 20, 2020. He describes the 2010s as being a decade of “unheard of economic distress.” Thanks to recession in the global steel market, exports were badly hit, with the Chinese dumping steel at “unthinkable” prices.24See (<)a href='https://www.thedollarbusiness.com/magazine/-the-chinese-are-dumping-steel-at-unthinkable-prices-/37195' target='_blank' rel='noreferrer noopener'(>)this interview(<)/a(>) with Ravi Uppal, head of Jindal Steel and Power, from January 2016. After the boom years of the first decade of the millennium, real estate volumes halved in 2012–2019. In telecoms, Reliance Jio (Mukesh Ambani) began a price war in the last quarter of 2016 that triggered a crisis throughout the industry. By September 2020 his brother Anil was pleading bankruptcy in a London court to forestall Chinese creditors; a year later the Pandora Papers would show him to have $1.3 billion stashed in no fewer than 18 offshore companies!25“Pandora Papers: Nine Big Takeaways from the Explosive Tax Haven Leaks,” (<)em(>)Financial Express,(<)/em(>) October 4, 2021.
The past decade has seen a succession of scams with the banks cheated out of thousands of crores, the collapse of two major airlines, and at least one gratuitous government intervention that devastated a huge informal sector that mostly runs on cash.
Over the last five years the commercial banks have written off more than ₹10 lakh crore (that is, ₹10 trillion equal to $126 billion) by way of bad loans. However, the major innovation of these years was the Insolvency and Bankruptcy Code (IBC) of 2016.
Bankruptcies and the centralization of capital
Under the IBC, companies bid for other companies that have declared bankruptcy under the Code. Since rival bids can lead to litigation, an appellate tribunal constituted under the Companies Act, 2013 (the NCLAT) hears appeals against orders passed by the National Company Law Tribunal and the Insolvency and Bankruptcy Board. The key point to note about these bids is that they are a powerful means of centralizing capital since the strongest bids come from rivals within the industry who have the deepest pockets. Thus ArcelorMittal acquired Essar Steel following a “bitterly contested legal battle that went all the way up to the Supreme Court.” In 2019 it was reported that:
Essar Steel’s capacity will immediately make ArcelorMittal the fourth biggest player in a nation where the administration plans to invest trillions of rupees in infrastructure… Without doubt India’s insolvency process is reshaping its steel industry. Five companies from the sector were among twelve large debtors ordered into the bankruptcy court in 2017 by the regulator in a clean-up of one of the world’s worst piles of bad debt.26“Homecoming Costs Tycoon $7 Billion in Year of Legal Drama,” (<)em(>)Bloomberg(<)/em(>), March 9, 2019.
In telecoms, the country’s sixth largest operator Aircel filed for bankruptcy in the National Company Law Tribunal (NCLT) in Mumbai “due to fierce competition and high levels of debt.” Aircel is the fourth telecom firm to wind up since Mukesh Ambani-led Reliance Jio debuted in September 2016, “unleashing a disruptive price war in the sector with its free voice calls and dirt-cheap data.”27“Aircel Goes Bankrupt, Becomes Fourth Telecom Player to Bow Out as Cut-Throat Price War Takes Toll,” (<)em(>)Business Today(<)/em(>), March 1, 2018. India’s largest cement maker UltraTech (Aditya Birla Group) acquired Binani Cement under the Insolvency Code but only once the Supreme Court upheld the appellate tribunal’s order approving the bid. Both layers of capital—that is, the declining traditional large business houses such as the Khaitans as well as more rapidly bankrupted newer conglomerate groups such as Essar (Ruias) and Videocon (Dhoots)—have been at the receiving end of insolvency decisions under the new law. Videocon’s assets were recently acquired by Vedanta (Anil Agarwal) at a stunning discount. Agarwal is said to have offered only 4.1 percent of the total outstanding claim of ₹88,000 crore.28Subrata Panda, “Vedanta Arm is Paying Almost Nothing for Videocon Group, Says NCLT,” (<)em(>)Business Standard(<)/em(>), June 16, 2021. The banks’ claims, equivalent to almost $12 billion, were reduced by a whole 96 percent. As for the Khaitans, it was recently reported that:
McNally Bharat, an engineering, procurement, and construction (EPC) company promoted by the Khaitan family of Williamson Magor Group was admitted for corporate insolvency in May this year based on a petition filed by Bank of India… The Khaitan family has completely exited Eveready Industries (by) mid 2022 by selling their stake to the Burman family, promoters of Dabur. The sale of Eveready Industries is linked to the stress faced by McNally Bharat. Khaitan had pledged shares of Eveready Industries to finance McNally Bharat… Separately, the Khaitan family is struggling to retain control of McLeod Russel India, the largest bulk tea producer in India.29Sangita Mehta, “Megha Engg, Nalwa Steel, Fifteen Others Keen on McNally Bharat,” (<)em(>)Economic Times(<)/em(>), October 22, 2022.
Here is a perfect snapshot of the last days of one of those disintegrating business families we began with.
These are early days yet. Thanks to the asset quality reviews instituted by the Reserve Bank when Rajan was governor and the willingness to acknowledge that the banks have a bad debt problem, Indian finance capital has only just woken up, and this despite the repeated early warnings that had piled up already by the end of the 1990s. That some companies will evoke considerable interest among competitors is obvious. Anil Ambani’s Reliance Capital, one of India’s largest NBFCs, has reportedly received fifty-four bids in all, with most bidders keen on buying the entire company. Again, it’s worth stressing that these are bids under the Insolvency Code. In this case both Tata and Gautam Adani are in the race.
The “divine right” of Indian promoters
India’s “mixed economy” model, constructed in the 1950s, depended crucially on the private sector being able to sustain accumulation through public investment. In Marx and Keynes, the German-American economist Paul Mattick argued that post-war British social democracy had envisaged the mixed economy “not as a partial transformation of private enterprise into state-enterprise, but as a full employment program realized through government initiative in order to increase production within the private-enterprise system.” Mattick also described India’s version of the mixed economy as “state-aided private capital development,” distinguishing it sharply from China’s state capitalism.30Paul Mattick, (<)em(>)Marx and Keynes: The Limits of the Mixed Economy (<)/em(>)(London, 1971), pp.145, 257. In India the correlation of public investment and industrial growth was obvious to state functionaries in the Congress Party. Minister of State for Finance K. V. Ganesh told Parliament in March 1972 that since 1962, when “public investment decreased, there ha[s] been stagnation in industrial growth.” Public investment and industrial growth, he maintained “have somehow become correlated as far as economics is concerned.”31K. V. Ganesh to the Lok Sabha, March 25, 1972, cited Chirashree Das Gupta, (<)em(>)State and Capital in Independent India (<)/em(>)(Cambridge, 2016), p.157.
With the dramatic decline in public investment that started as early as the mid-1970s, the government’s priority by the early eighties increasingly came to focus on the expansion and modernization of the private sector. The Sixth and Seventh Plans (1980–1990) “depended for the first time on major increases in private investment,” which was expected to grow 4½ times in the early eighties, then double again in the late eighties.32Francine R. Frankel, (<)em(>)India’s Political Economy, 1947–2004 (<)/em(>)(New Delhi, 2005), p.586. Thus by the time the economy was thrown open in the 1990s, US investment banks could describe India as having “a huge and vibrant corporate sector.” But it was clear to almost every one of the 170-odd corporate interviewees who were interviewed by two colleagues and myself towards the end of the decade that the corporate sector was no longer a homogeneous bloc. One banker referred to “smaller companies which are relatively new, where there are extremely aggressive, successful family managements… A lot of these managements have had education abroad, they’ve worked abroad in companies which have specialized in their industry.” They were “a new generation of businesses who want to grow very fast.” There could scarcely have been a better description of the group that figures in the Tables as “stand alone” New Capitalists. But, about many of the larger business groups, this banker said, “Lots of them, Essar, Singhanias, are all absolutely declining quite rapidly, really.” Another professional, who retired recently from what was then Booz Allen & Hamilton, said, “The middle tier, the Mittelstand of Indian capitalism, is deeply troubled. Clearly, family businesses in that group are in deep, deep trouble.” So by the end of the 1990s differences such as these were fairly obvious. But the vast majority of those interviewed would have agreed with one banking analyst who claimed, “There are very few very good companies in India,” by which he meant companies that were not just well managed but mindful of the interests of minority shareholders and in this sense serious about corporate governance.
This is not the place to produce an inventory of the corrupt and self-dealing nature of the way a whole swathe of promoter-dominated companies have been run—even when those companies have “professional” managements and “independent” directors and the rest of it. In his first speech as governor of the Reserve Bank, Raghuram Rajan is supposed to have said, “Promoters do not have a divine right to stay in charge regardless of how badly they mismanage an enterprise… Nor do they have the right to use the banking system to recapitalise their failed ventures.”33Rajan cited Crabtree, (<)em(>)Billionaire Raj(<)/em(>), p.191. In November 2014 this was followed by his Verghese Kurien memorial lecture where the same theme was aired:
In India, too many large borrowers insist on their divine right to stay in control despite their unwillingness to put in new money… [T]he promoter threatens to run the enterprise into the ground unless the government, banks, and regulators make the concessions that are necessary to keep it alive… Why do we have this state of affairs? The most obvious reason is that the system protects the large borrower and his divine right to stay in control… the amount banks recover from defaulted debt is both meagre and long delayed.
And again:
When recovery actually takes place, the enterprise has usually been stripped clean of value. The present value of what the bank can hope to recover is a pittance. This skews bargaining power towards the borrower who can command the finest legal brains to work for him in repeated appeals, or the borrower who has the influence to obtain stays from local courts—typically the large borrower. Faced with this asymmetry of power, banks are tempted to cave in and take the unfair deal the borrower offers. The bank’s debt becomes junior debt and the promoter’s equity becomes super equity. The promoter enjoys riskless capitalism—even in these times of very slow growth, how many large promoters have lost their homes or have had to curb their lifestyles despite offering personal guarantees to lenders?… The system renders the banker helpless vis-à-vis the large and influential promoter.34The lecture can be read here: (<)a href='https://rbi.org.in/scripts/BS_SpeechesView.aspx?Id=929'(>)https://rbi.org.in/scripts/BS_SpeechesView.aspx?Id=929(<)/a(>)
When Rajan’s term as governor was drawing to a close by the middle of 2016, his Chicago colleague Luigi Zingales wrote about the anger he had engendered amongst India’s “great political and economic dynasties, who established their power on political connections, if not directly on corruption.”35Luigi Zingales, “RBI Governor Raghuram Rajan’s Fight Against Crony Capitalism,” (<)em(>)ProMarket(<)/em(>), June 11, 2016. Zingales chose to frame this tension between Rajan and big capital as a “fight against crony capitalism.” Since this has now become such a widespread characterization of state-capital relations in countries like India, it’s worth returning to Venu’s point about the systemic nature of “cronyism” as well as Nayak’s assertion that “there is corruption in the system.”
The kind of shameless favoritism that promotes one industrialist or one group of magnates over another cannot possibly capture what is meant by saying there is corruption in the system. Big business has always managed politics through influence peddling, regulatory capture, political donations to campaign finance, and so on. But the field of this management of politics is “many capitals,” that is, the competition between capitals and the unabashed ability of some to move far ahead of the others by using their proximity to government. This was as much the case with Reliance under both Dhirubhai and his two sons as it is the case with Gautam Adani today. What the term “crony capitalism” does is call for a level playing field between capitals. What it does not do is address the issue of the governance of capital—let alone the accountability of promoters either as a fraction of capital or as a class. Implicit in Rajan’s critique is the suggestion that India could strive for a more efficient form of industrial capitalism, one closer, say, to that of the bank-based economies (Germany, for example), or one in which the mass of large companies are widely held, and where there is a substantially larger number of well-managed independent firms of the kind which are currently so rare in India. (These constitute only six companies out of 270, as shown in Table 1.)
In conclusion, it’s worth drawing attention to the extraordinary implications of the July 2018 NCLT order which put a formal end to the conflict between Cyrus Mistry and Ratan Tata.36Tragically, Cyrus Mistry died in a car crash on September 4, 2022. Governance issues were at the heart of the bitter clash triggered by the latter’s unceremonious sacking of Cyrus Mistry in October 2016. A key issue underlying those tensions was the control exercised by the Tata Trusts over the operating companies of the group through the unlisted holding company Tata Sons. When Mistry became Chairman of Tata Sons in 2012, the implied understanding was that he would have the same freedom to run the group that Ratan Tata himself had previously enjoyed. This proved not to be the case. Mistry took over as the slowdown was starting to have a major impact on profitability. Worst affected was Tata Steel Europe (formerly Corus Group plc), which found the UK government ignoring the company’s requests for protection against the Chinese dumping of steel. By 2016 it was losing $1 million a day, and “losses were accumulating faster than the profitable Indian operations could clear them.”37Nevin John, “Trophy Buy, Distress Sale”, (<)em(>)Business Today(<)/em(>), May 8, 2016.
Mistry’s decision to cut losses by looking for a buyer for Tata Steel Europe would have had to have been a major flashpoint, given the prestige that Tata himself associated with the Corus acquisition. When the matter ended up in court, the arguments from Tata’s formidable legal team sounded simply ludicrous in strictly capitalist terms. Harish Salve claimed publicly that “Mistry’s emphasis on profitability by writing off loss-making businesses did not fit with the overall ethos of the Group”—as if the Tatas were in business for reasons other than sustaining profitable businesses.38Salve quoted in Deepali Gupta, (<)em(>)Tata vs. Mistry: The Battle for India’s Greatest Business Empire (<)/em(>)(New Delhi, 2019), pp.46-7. Gupta’s book is by far the best account of this dismal episode in Tatas’ history. Mircea Raianu, (<)em(>)Tata: The Global Corporation That Built Indian Capitalism (<)/em(>)(Cambridge, Mass., 2021) brings his story down to these recent events. “When Corus was purchased it was a commitment to the British government,” Salve said, ignoring the fact that UK Chancellor George Osborne had steadfastly refused to impose an anti-dumping duty when the company had called for one and thus partly caused the losses. Salve’s “Tata is an institution” line was simply nonsense. For his part, Mistry had obviously resented interference in key business decisions. He explained to the court that “Ratan Tata’s interference loomed over all decisions he had wanted to make through his tenure.” “The Trusts often breached protocol by interfering excessively,” a criticism that was entirely supported by the general legal counsel of the group who emailed Mistry to say, “a prominent law firm had told him that there was a general impression in the market that the Trusts control Tata Sons and Cyrus does not have a free hand, but no one knows the exact mechanism through which the Trusts exercise control.”39Gupta, (<)em(>)Tata vs. Mistry(<)/em(>), pp.96 (interference by Trusts), 116 (Vasani’s email), 129 (loomed over all decisions).
As for the NCLT order, which was subsequently upheld by the Supreme Court, this argued that Mistry had laid too much emphasis on having a “free hand” in managing affairs of the Tata Group. This, it claimed, was “incongruous with corporate governance.” In order to protect the minority shareholder, the argument went, the majority’s viewpoint could not be overlooked. “Otherwise, it will become curtailment of the rights of the majority shareholders.”40Gupta, (<)em(>)Tata vs. Mistry(<)/em(>), pp.218-219. There could scarcely be a better indication of how deeply entrenched the “divine right of promoters” has become in the sinews of Indian society, and how well this chimes with the majoritarianism that currently dominates India’s political life.
 World